Pick, Pack & Ship
Six Strong 90s Multiply to 64%: The Perfect-Order Math
Fulfillment KPIs don't average, they multiply. Six scores in the 90s land at 64%, and that's the order your customer actually opens. Here's how to read the real number and fix the link dragging it down.

Your fulfillment metrics don't average, they multiply. Six components that each score a strong number in the 90s don't add up to a 90-something experience. Multiply them and you land around 64%, and that 64% is the order your customer actually opens.
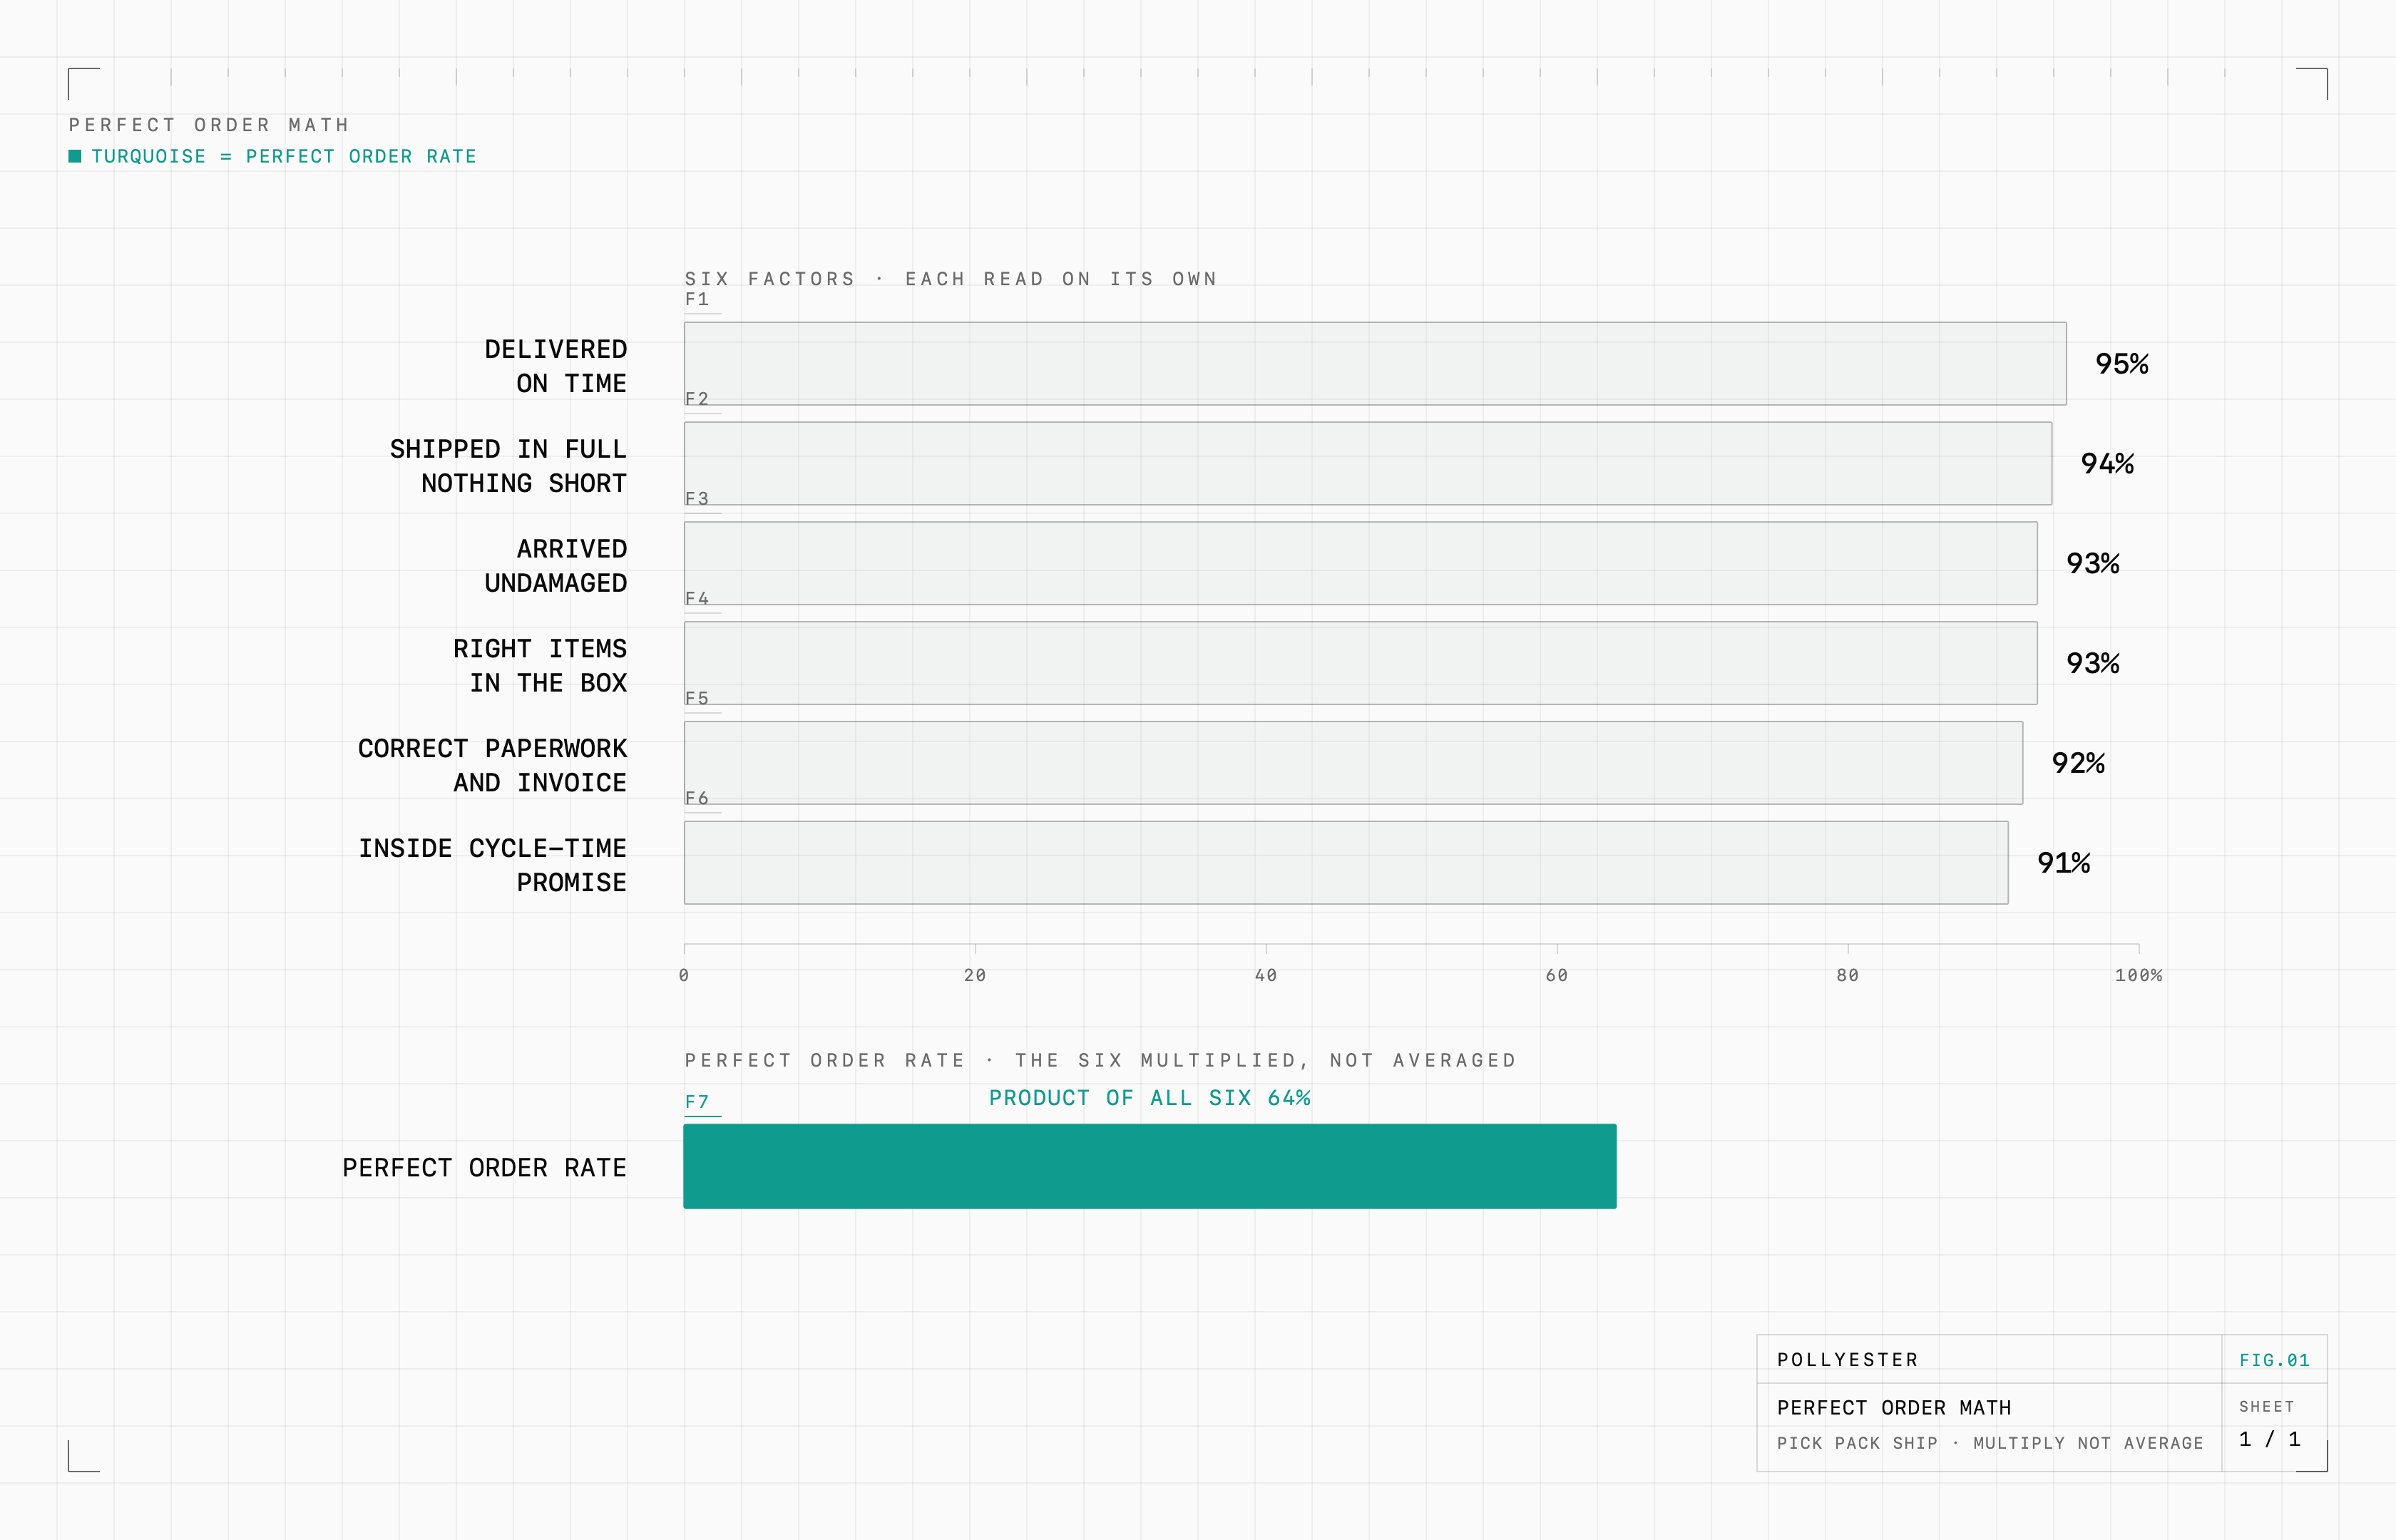
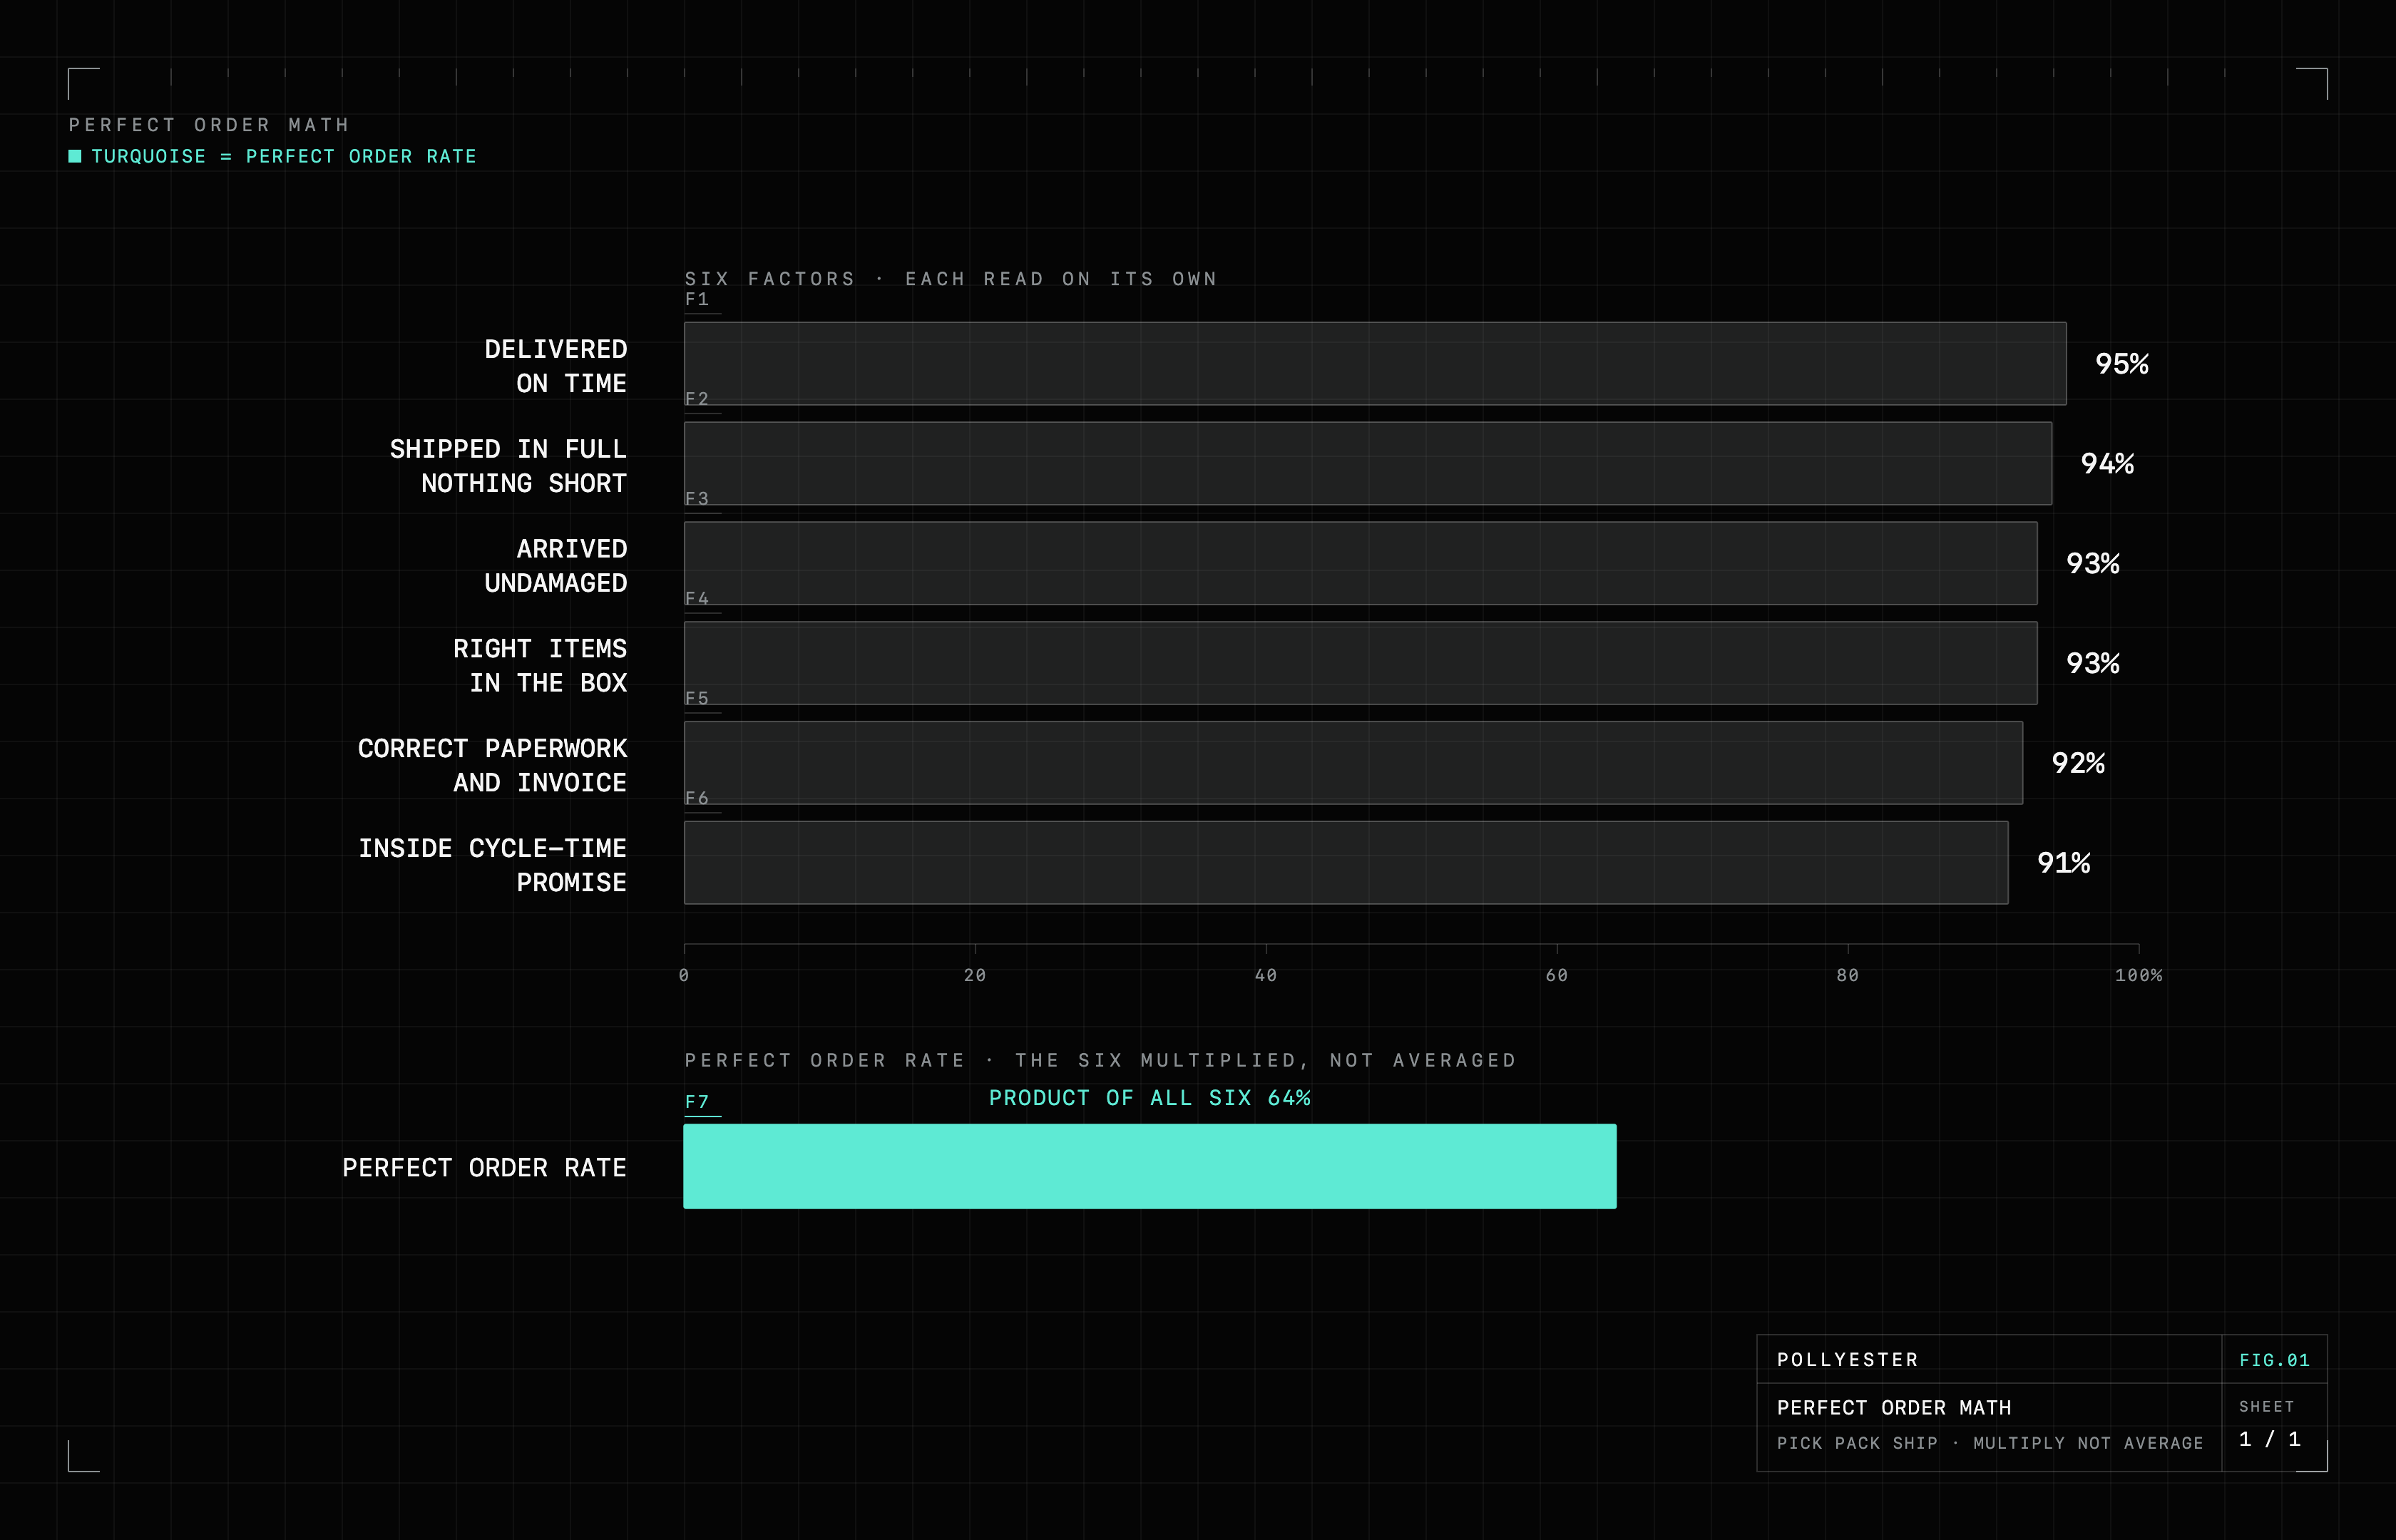
Here's the arithmetic, because it's the whole point. Take a real order and walk it through the steps that have to go right for it to count as perfect:
- Delivered on time: 95%
- Shipped in full, nothing short: 94%
- Arrived undamaged: 93%
- Right items in the box: 93%
- Correct paperwork and invoice: 92%
- Inside your cycle-time promise: 91%
Every one of those is a number you'd be happy to report, and none would get flagged in a Monday ops meeting. But an order only counts as perfect if all six go right at once. Multiply them and the honest result is about 64%. One order in three arrives late, wrong, short, or damaged, and nobody on your team is looking at that number because it doesn't live on any single dashboard.
Why nobody sounds the alarm
This is the quiet failure mode of a fulfillment scorecard. Each number gets watched in its own row, by its own owner, against its own target. On-time delivery sits with the carrier, itself the output of the orchestration brain behind the order, pick accuracy with the warehouse, damage with packaging, and every one of them reads healthy, so the meeting moves on.
The customer never sees your rows. They see the order, and the order is all six multiplied together, a worse number than any single metric will admit. The Perfect Order Rate is the only figure that tells the truth here, and the best operators sit at 97%+ (SKUTOPIA, via our pick-pack-ship brief). The gap between 97 and 64 isn't a rounding error. It's most of a broken experience hiding behind six numbers that all look fine.
The loudest complaint in your inbox is usually about your best-performing step, while the points you can actually recover sit in the quiet one nobody's escalating.
The number that compounds is the number that matters
Once you accept that the components multiply, it changes where you spend. Chasing any single 90 up to a 95 barely moves the real rate, because the points you can recover are all sitting in your weakest link.
Watch how it moves. Your strongest component above is on-time at 95%. Push it as high as it can go, call it 98, and you multiply the whole rate by about 3%. It ticks from 64 to roughly 66. Now take the weakest, cycle-time at 91, and get it to 96. Same five points on paper, but it multiplies the whole rate by more than 5%, so the perfect order rate moves from 64 to about 68.
The reason is simple. Your strong numbers are already near the ceiling, so there's almost no room left in them. The weak one has room, and because everything multiplies, closing that gap flows straight through to the rate the customer feels. The loudest complaint in your inbox is usually about your best-performing step, while the points you can actually recover sit in the quiet one nobody's escalating.
One order in three arrives late, wrong, short, or damaged, and nobody on your team is looking at that number, because it doesn't live on any single dashboard.
The how-to: measure, multiply, prioritize
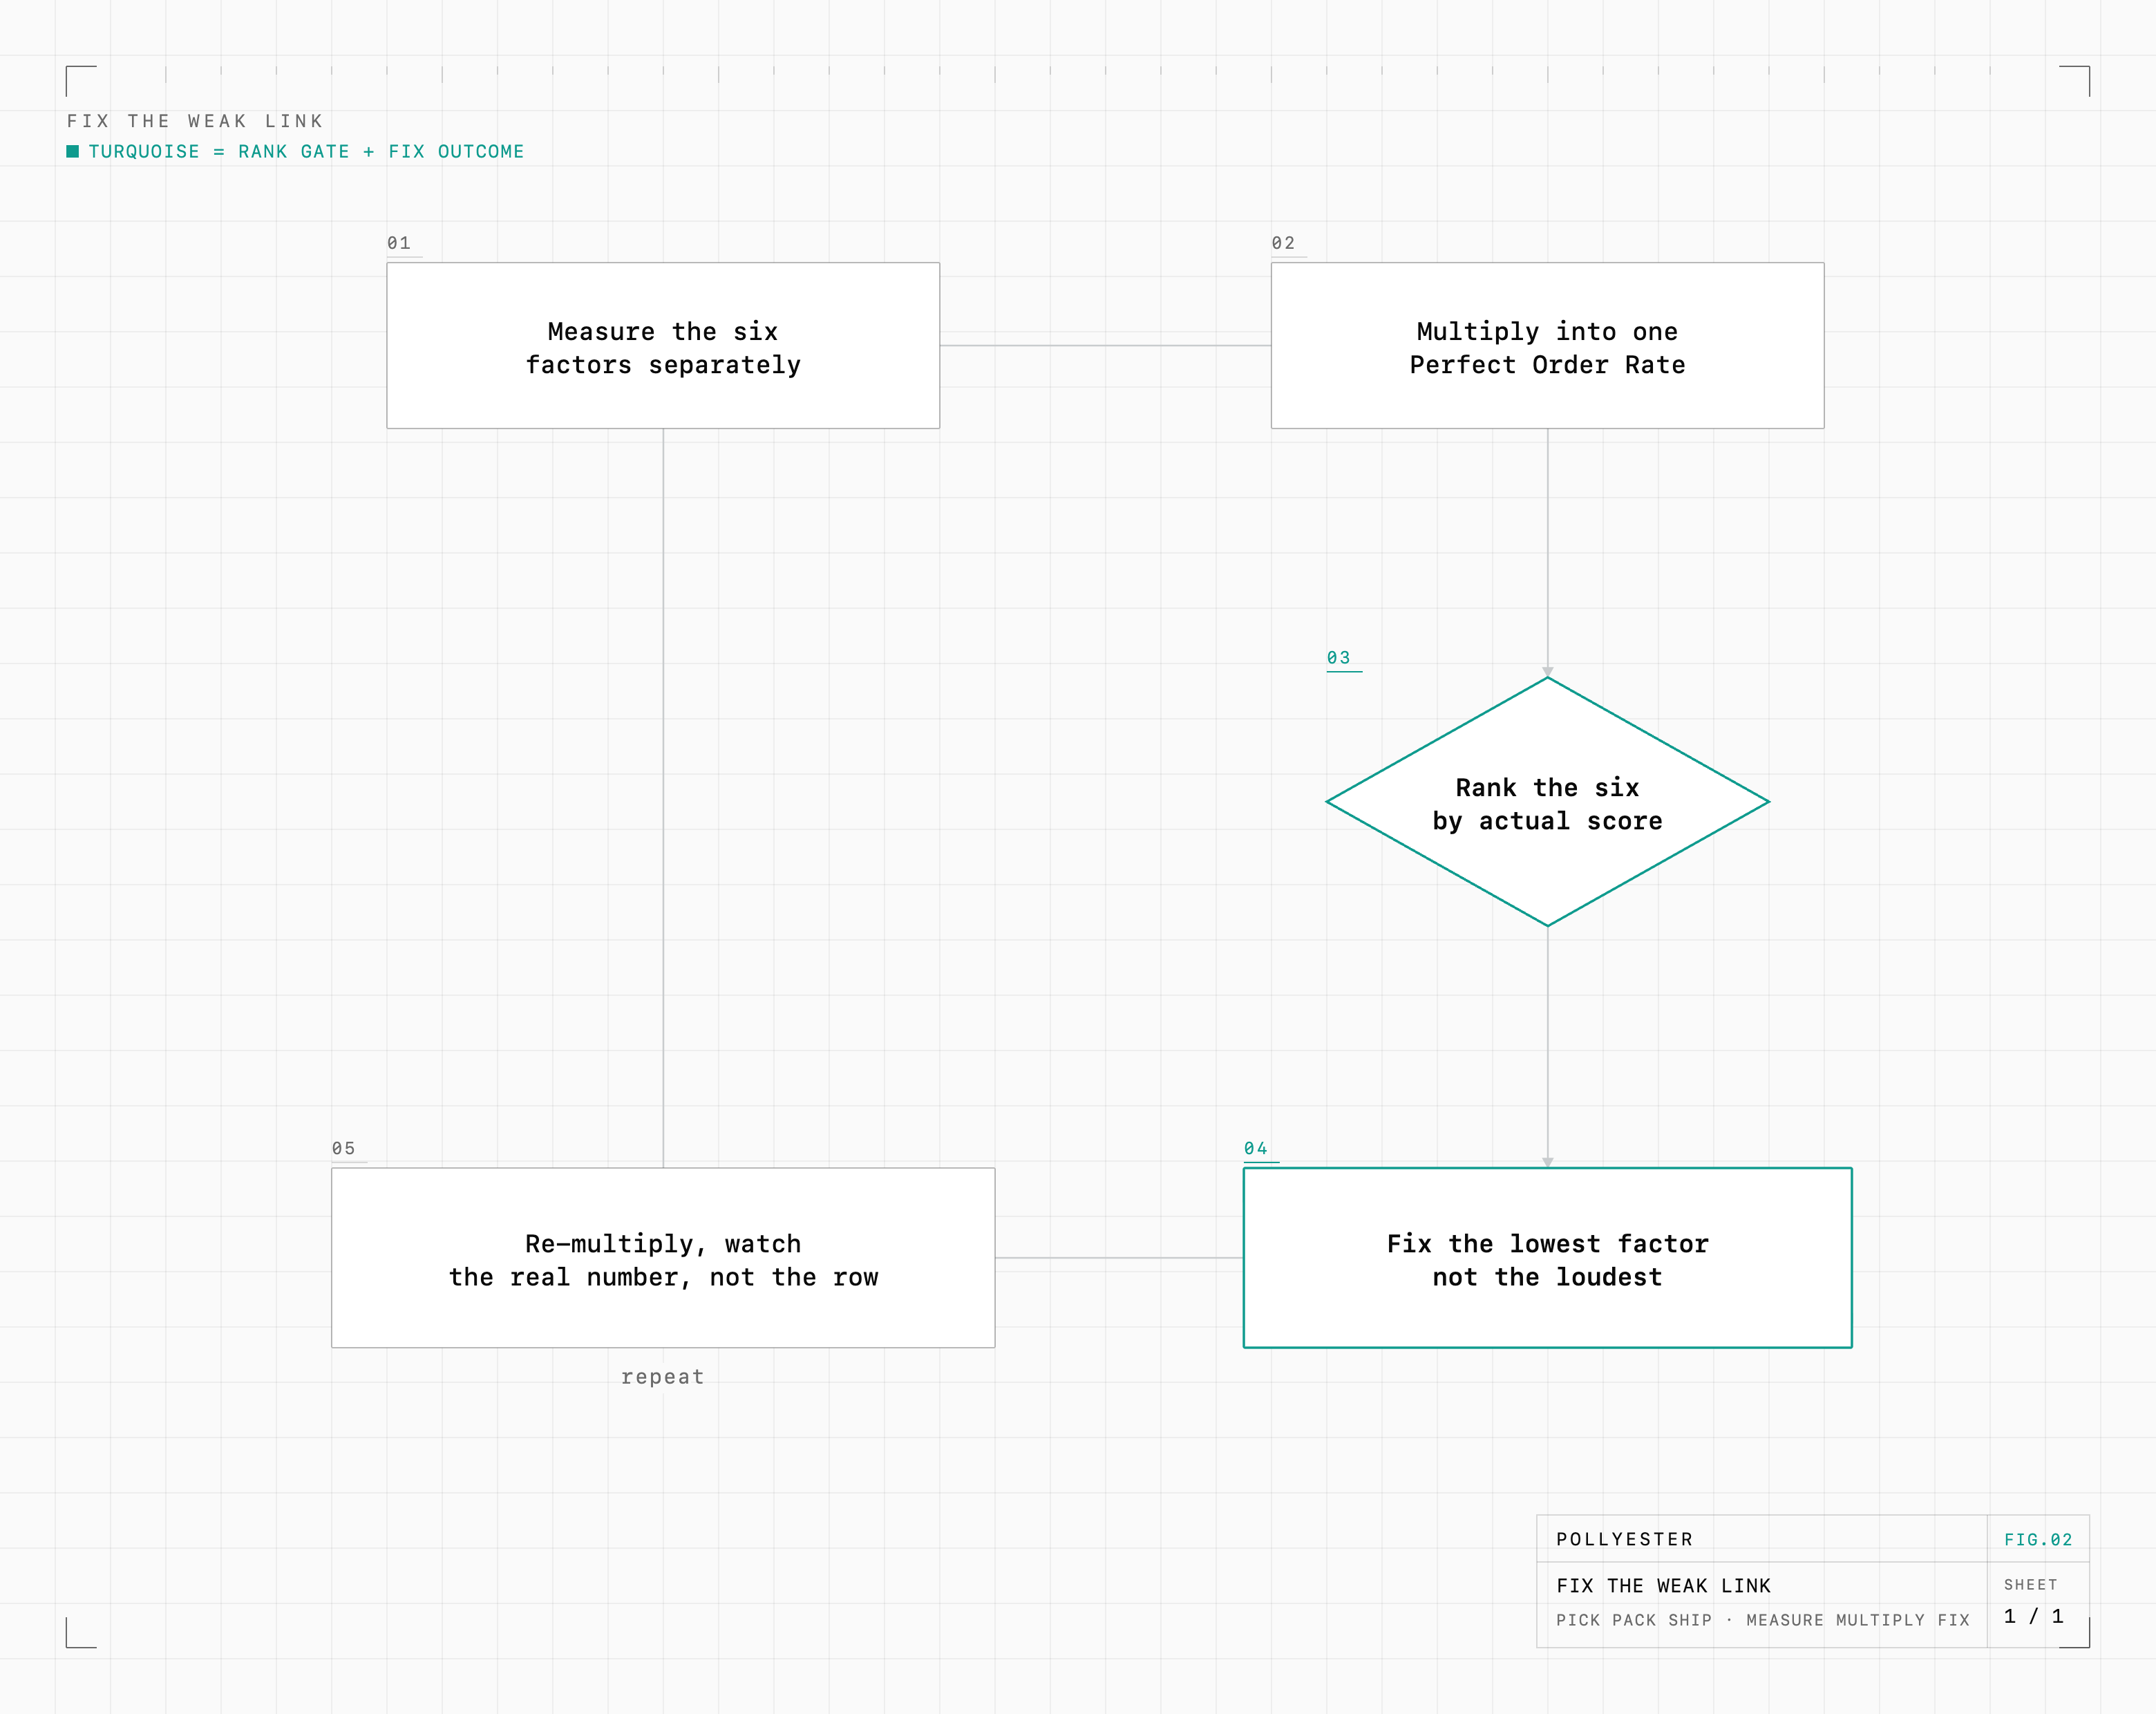
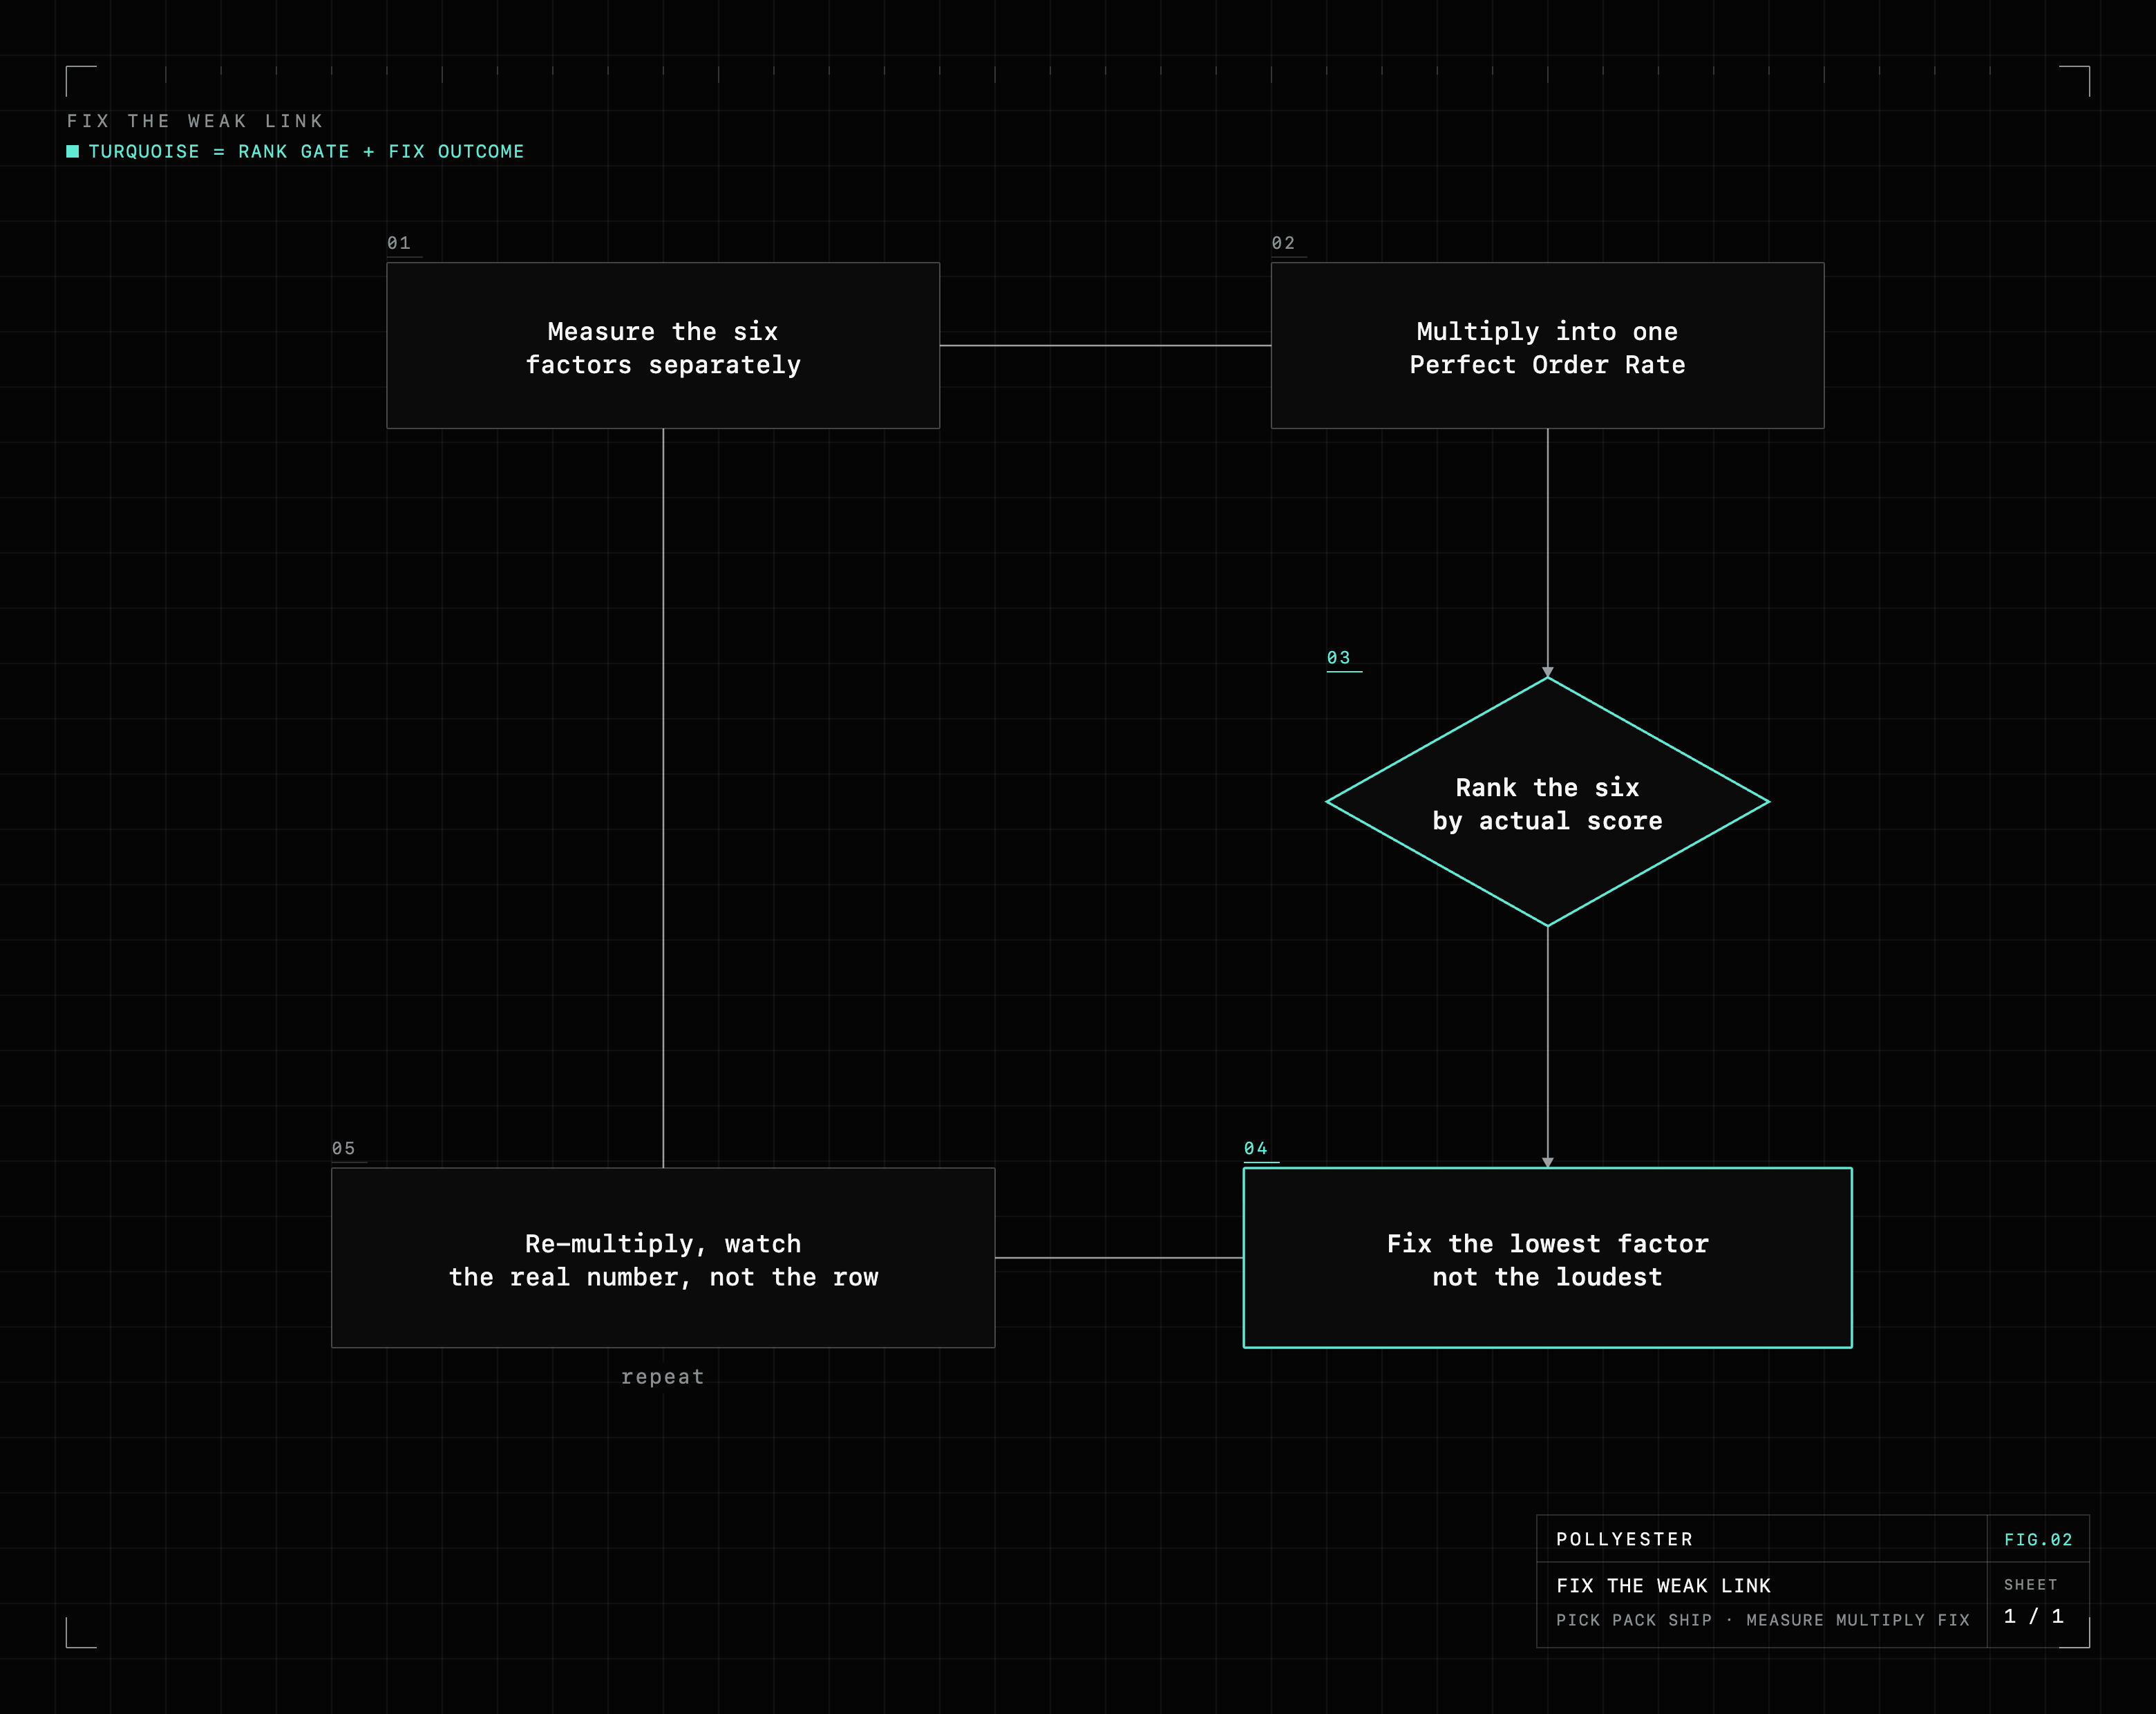
The work isn't complicated, but it has an order to it.
Measure the six components separately, then multiply them into one rate. You need each factor on its own before you can find the laggard, the six signals of pick, pack and ship execution: pick accuracy (the best hit 99.8%+), on-time delivery, damage-free arrival, order completeness, correct documentation, and order cycle time under 12 hours (SKUTOPIA, via our pick-pack-ship brief). Most brands have three or four of these somewhere in a spreadsheet and guess the rest. Get all six clean, pulled into one place, and multiplied into a single Perfect Order Rate you look at every week.
Prioritize the lowest factor, not the loudest. This is the discipline. Rank the six by their actual score and put your team and your vendors on the bottom one, even if it's generating fewer support tickets than a number two rows up. The math sets the priority, not the volume of noise. A step at 91 with room to run beats a step at 95 near its ceiling, every time.
Re-multiply after every fix and watch the real number, not the row. The point of a Perfect Order Rate is that it can't hide. Improve the weak link and the compounded number moves where you can see it. Polish a strong link and it barely budges, which tells you not to spend there again.
Why this is a retention argument in pet
If you sell pet, the perfect order rate isn't a quality metric, it's a churn metric, and churn is the whole game.
The category runs on replenishment. Chewy hit 83.3% of sales on Autoship and $591 in net sales per active customer (Chewy 8-K, via our verticals brief). That's the model working: a subscriber who reorders on a schedule and compounds in value for as long as nothing goes wrong. Now put the failure rate next to it. Pet subscription churn runs 6 to 10% a month (Eightx, via our verticals brief), and these are heavy, replenishment-critical boxes. When the food shows up late, or the wrong formula arrives, or the bag is split open, that's not a support ticket, it's a reason to cancel, and in pet the reorder was the entire relationship.
So run the math on your own volume. Say you ship 10,000 autoship boxes a month at a 64% perfect order rate. That's 3,600 defective boxes going out to subscribers you've already paid to acquire. Get the rate to 80% and you've removed roughly 1,600 of those a month, boxes that were nudging people toward the cancel button. Hold even 300 of those subscriptions that would otherwise have churned, and at Chewy's $591 per active customer you've protected around $177K a year, on orders you were already shipping. The acquisition budget didn't move. The box just showed up right.
The good news is that the weakest link is often the most fixable one. Pick accuracy is a common laggard, and cameras that check each order against what was ordered before it ships have shown a 72% drop in mispick-related returns (Portable Intelligence and Swiftflutter, via our pick-pack-ship brief), since returns are the other leak a low perfect order rate feeds. That's a fix aimed at one of the six factors, and if pick accuracy is your low number, it moves the compounded rate more than anything you could do to the five that are already strong. Which is the discipline again: find the number holding the others down, and put the fix there.
Stop averaging your way to comfort
Six strong scores that average in the 90s feel like a healthy operation. Multiplied, they're a 64% experience and a churn problem you can't see from any single row. Find the number in the 90s that's quietly dragging the other five down, fix that one, and re-multiply. That's the honest read, and it's the only one your customer ever gets.