Pick, Pack & Ship
Returns Are 25% of Apparel. Two-Thirds of It Is Fit.
Most brands attack returns at the warehouse. The money leaks at the point of purchase, in a fit decision made wrong. That's where AI belongs, and contribution margin is how you know it worked.

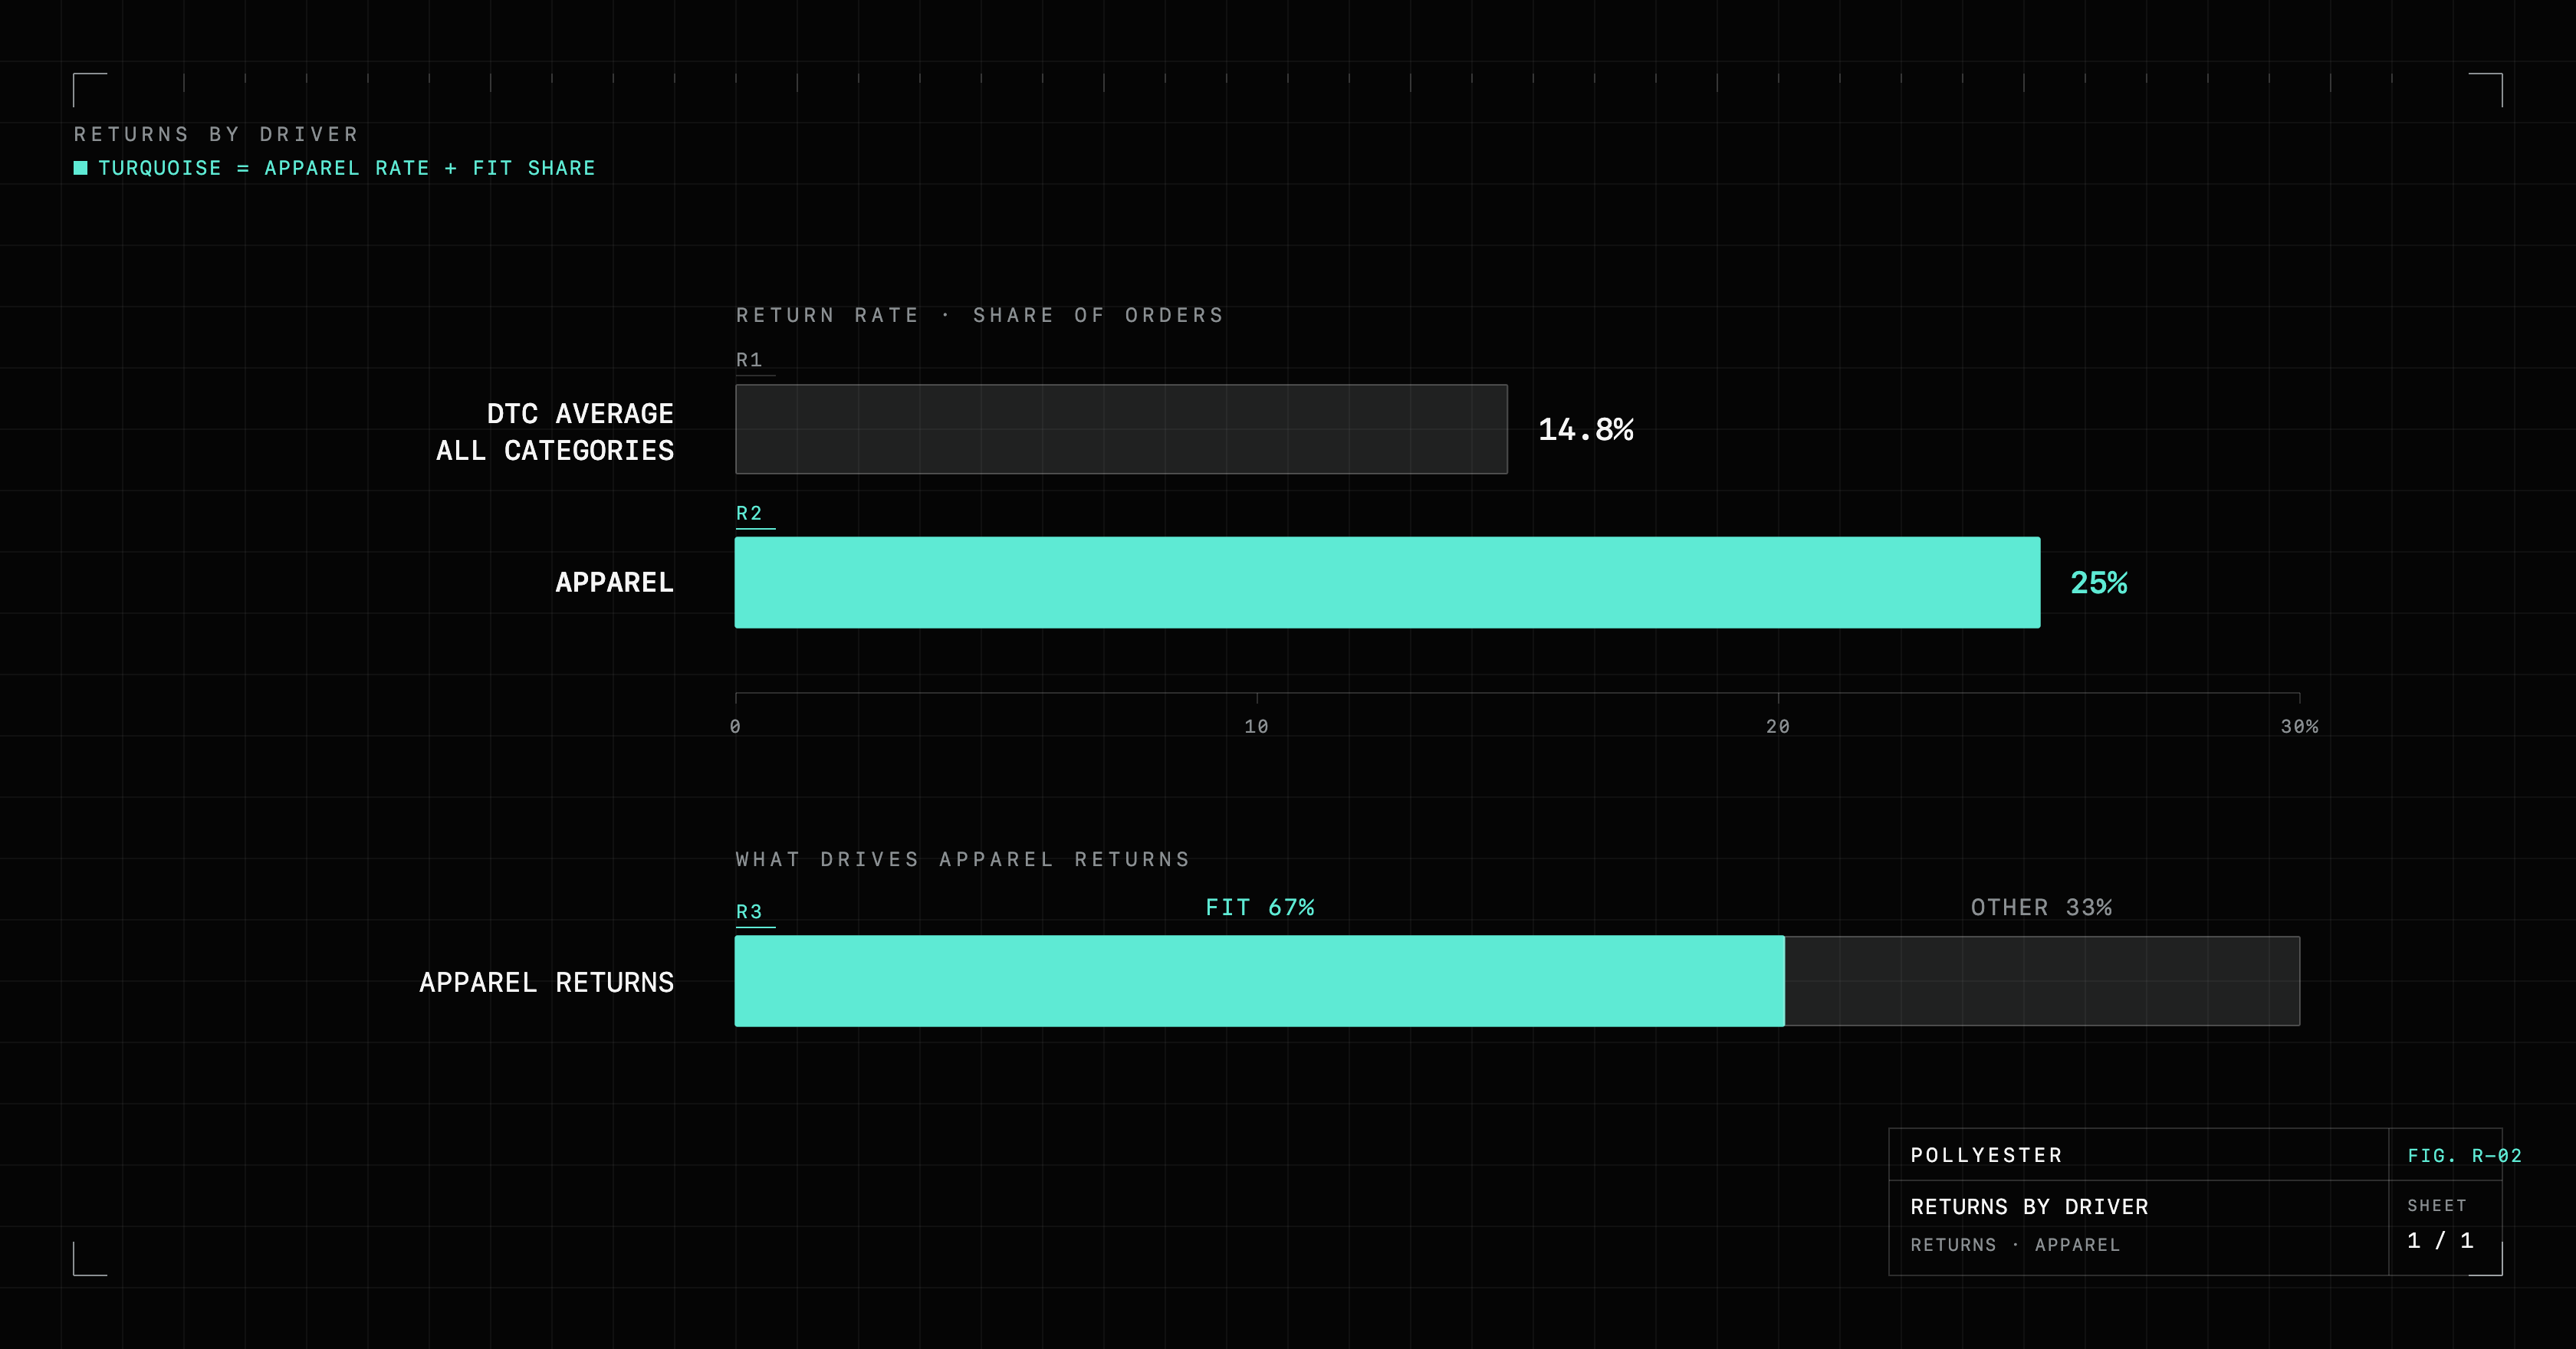
About a quarter of everything an apparel brand ships comes back. The DTC average across all categories is 14.8%, apparel runs near 25%, and some subcategories hit 30 to 40% (Eightx and Richpanel, via our verticals brief). And 67% of those returns come down to one thing: the item didn't fit the way the customer expected.
So the biggest cost line in fashion ops isn't a warehouse problem. It's a fit problem that shows up at the warehouse.
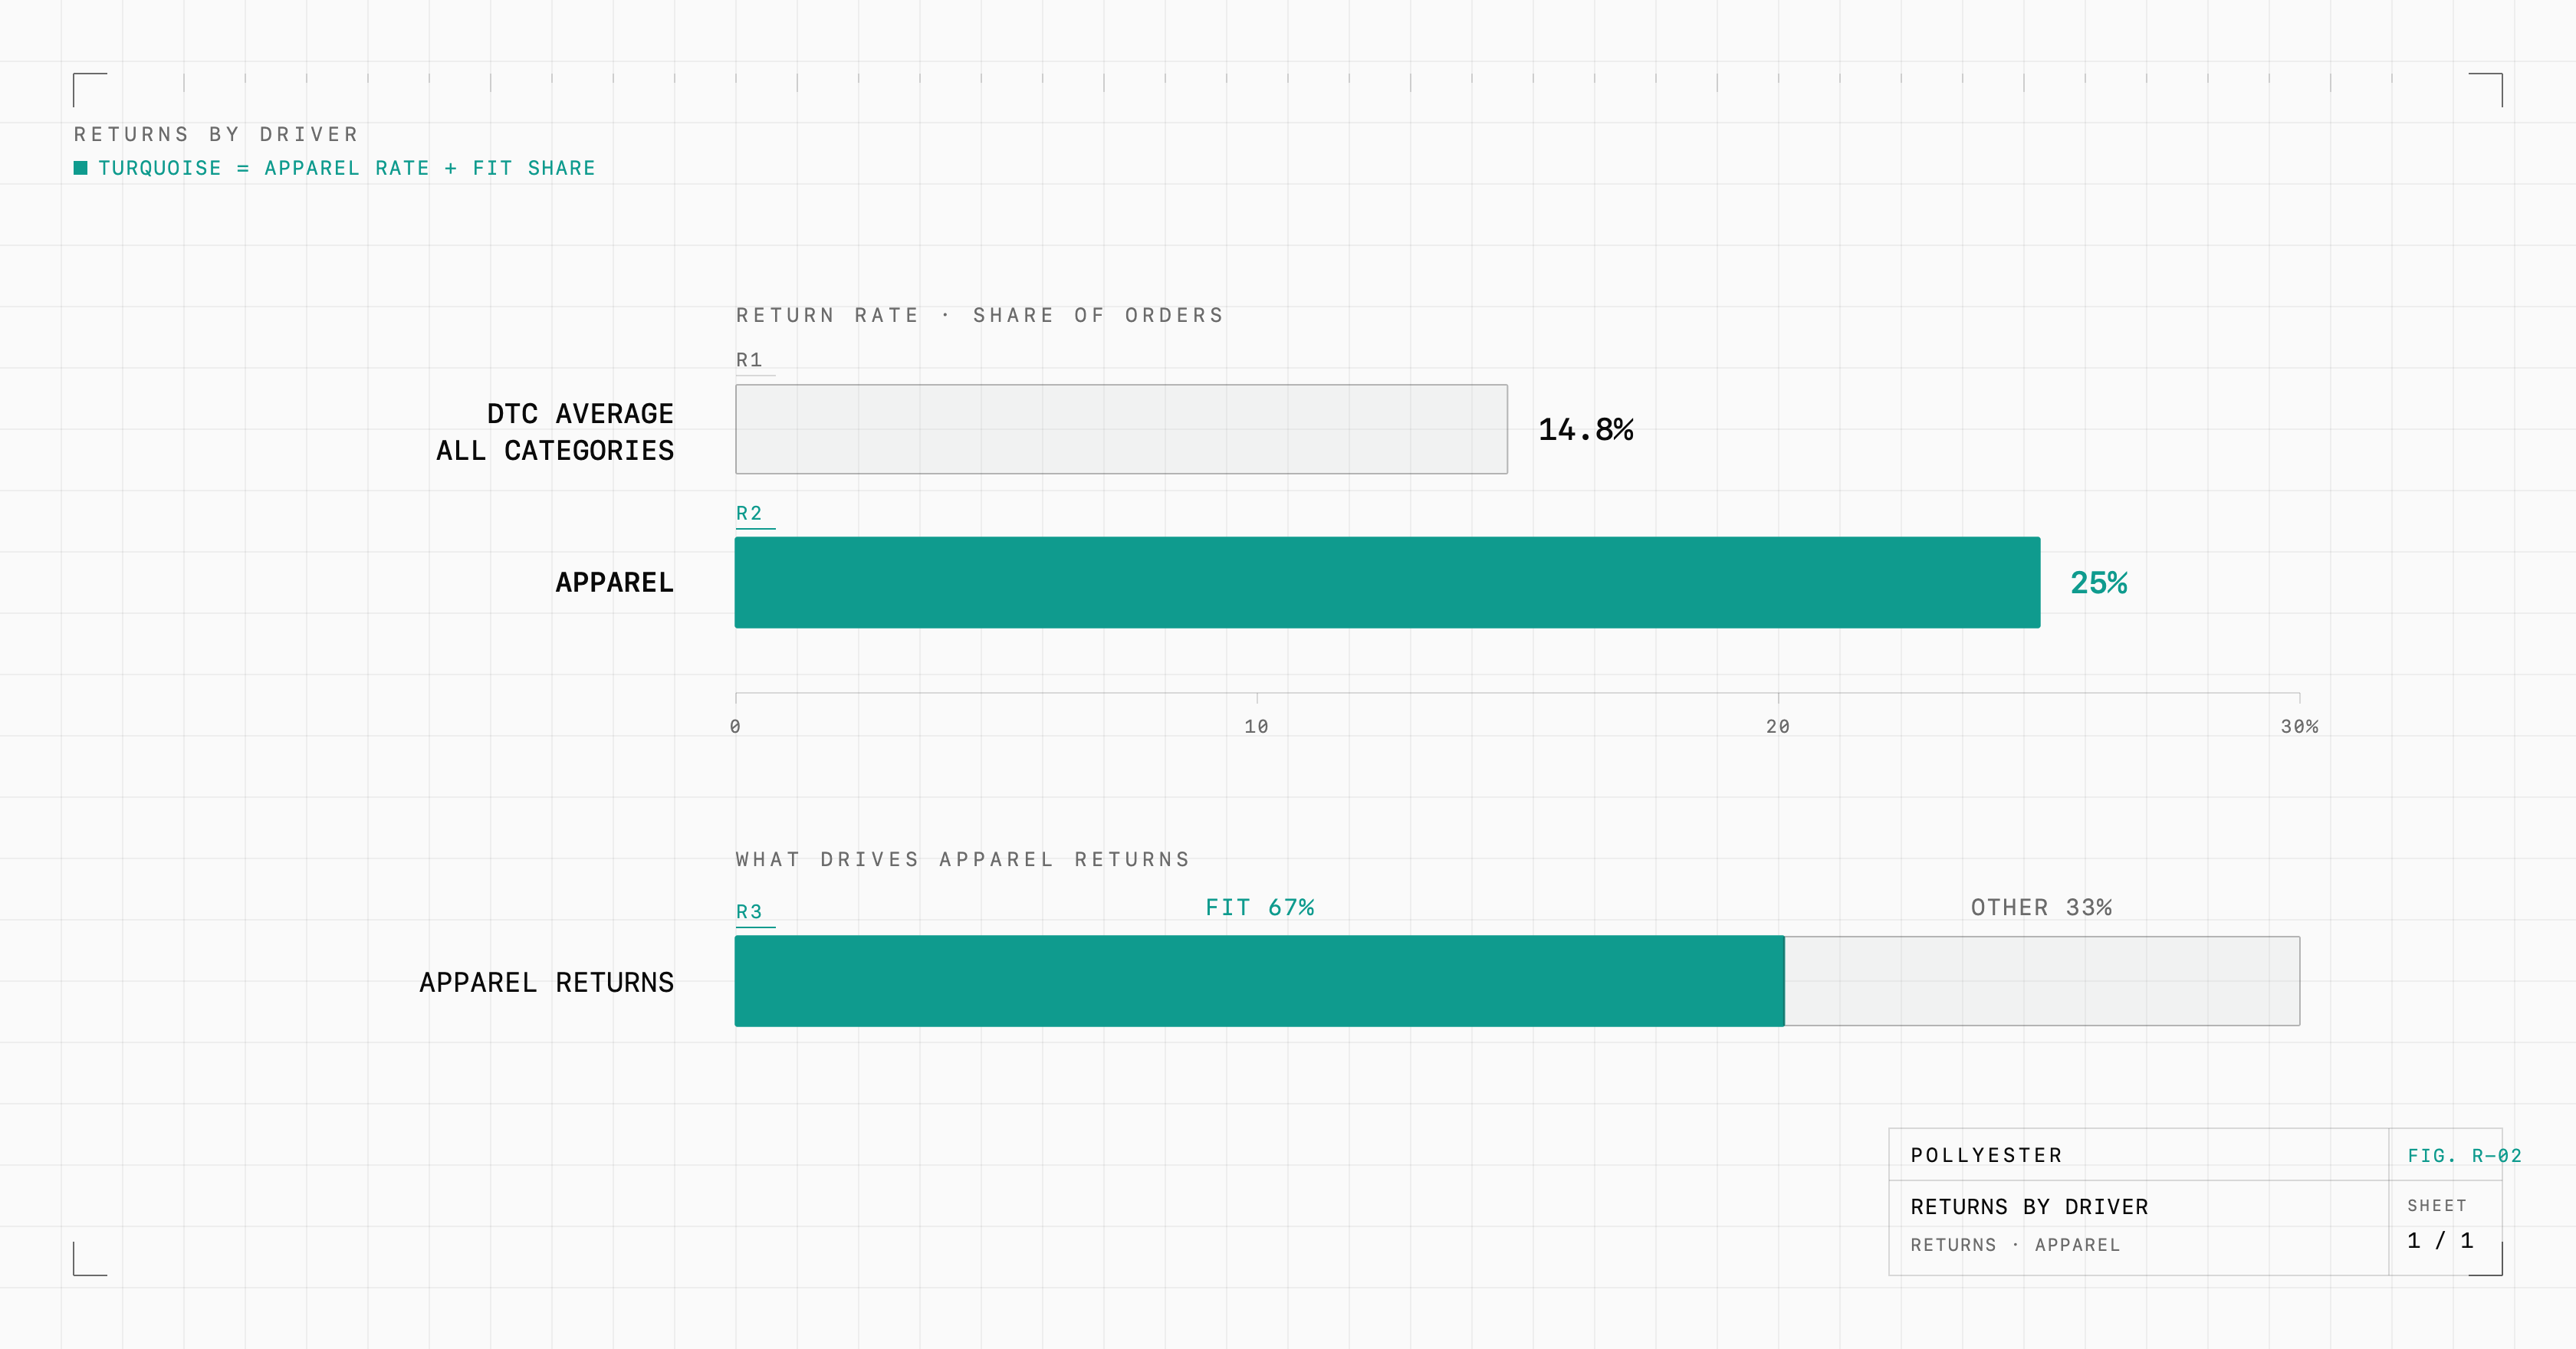
The costliest place to fix a return is the last place brands look
In most apparel ops teams, the returns conversation is about processing. Faster restocking, cheaper return shipping, a better portal, a better rate on getting product back from the customer. That work is real and some of it saves real money. But it treats the return after it has already happened. The decision that caused it was made weeks earlier, when a customer guessed at a size and guessed wrong, because fit is decided on the product page, not at the warehouse.
By the time the box comes back, the best you can do is process it cheaply. The place to actually save the money is earlier, before the wrong size ever ships. In a category where the return rate is the number that defines you, that gap is worth a lot.
By the time the box comes back, the best you can do is process it cheaply.
Here's the cost in plain figures. Take a $10M apparel brand at a 25% return rate. That's roughly $2.5M in goods flowing back through your door every year, plus $375K to $625K to process them, before you count markdowns on anything you can't resell at full price (Eightx, via our verticals brief). A returned order isn't a wash, it's a loss. You paid to ship it out, you pay again to ship it back and process it, and often you mark it down to sell it a second time.


The fix is upstream, and it's a job AI can actually do
If two-thirds of returns are fit, the tool that pays for itself fastest is the one that helps a customer buy the right size the first time. AI sizing and fit prediction can cut fashion returns by up to 60% (Mirrorsize, via our verticals brief). Put that against the cost stack above. On our $10M brand, moving the return rate from 25% toward 10% takes about $1.5M of goods out of the return pipe and pulls a matching chunk out of that $375K to $625K in processing. That's margin you already earned, kept instead of lost.
This is also the honest version of the AI story in apparel. It isn't a chatbot or a demo. It's a model that reads a customer's measurements and past purchases and tells them, with real confidence, which size to buy. Beauty already showed the pattern works when the tool goes after the real return driver. Try-on there lifted conversion for early adopters because it answered the shade question that was sending product back. Apparel's version answers the fit question.
The trap: a conversion win that loses money
Now the part that separates a real fix from an expensive one.
The moment you put a fit or try-on tool on the site, someone will measure it against add-to-cart. It will look great, because engaging tools lift engagement. That's the trap. A try-on feature can raise conversion and raise returns at the same time, and if you're only watching conversion, you'll call it a win while it drains margin.
A tool that makes bracketing easier is optimizing the exact behavior that's bleeding you.
Here's how it goes wrong. The tool lifts conversion, so you write more orders on the same traffic. Good, until you notice the extra buyers were the uncertain ones, the people who needed convincing, and they send product back at a higher rate than everyone else. Each of those returns costs you the round-trip shipping and the processing, plus a possible markdown. Do enough of it and the orders you won cost more to fulfill than they ever brought in. You spent money to book sales that lose money, and cheered the conversion chart while you did it.
It gets worse in apparel, because 51% of Gen Z bracket on purpose (Eightx and Richpanel, via our verticals brief). Bracketing is buying three sizes to keep one and send two back, using your warehouse as a fitting room. A tool that makes bracketing easier is optimizing the exact behavior that's bleeding you.
The scoreboard that keeps it honest
The only way to know whether a fit tool is working is to measure it where the money actually moves. Three numbers, on your own before-and-after data, not a vendor's slide.
Return rate for the people who used the tool. Not site-wide, not add-to-cart. Did the customers who used fit prediction return less than the ones who didn't? If the tool works, that number drops. If it's only driving engagement, it won't.
Exchange rate on returns. When a return does happen, does it turn into an exchange or a refund? More than half of returns can be turned into exchanges instead of refunds (Kodif, via our fulfillment brief). An exchange keeps the revenue and the customer, a refund loses both. Making exchange the easy default is the retention half of a returns program, and you can measure it to the dollar. Watch, too, for the refund requests that aren't honest returns at all, because once you've cut the fit-driven ones return fraud is the next problem probing the same policy.
Contribution margin per order. This is the one that catches the vanity win. It nets out cost of goods, shipping both ways, processing, and markdowns, so a converting order that comes back shows up as the loss it is. If your fit tool lifts conversion while contribution margin per order falls, you've bought yourself a more expensive business. When it rises, the tool earned its place, whatever the conversion chart says.
Two of these three cost nothing but the discipline to look. The one thing worth building is the connection that ties each return, exchange, and markdown back to the order and the tool that produced it, so the before-and-after is real, measured on your own orders.
What actually gets built
None of this requires owning a warehouse, and Pollyester doesn't. The work is choosing and connecting the right tools. Pick the fit-prediction tool that moves your return rate, not the one that demos best. Set up returns so an exchange is the easy path and more refunds stay as revenue. Then build the margin measurement so you can tell a real win from a vanity one. Downstream still matters, and AI helps there too. Camera checks on the pick, pack and ship line, comparing what's in the box against the order, cut the returns caused by shipping the wrong item. Getting each order right the first time is the perfect-order math upstream of any return, and it closes the returns you cause yourself. It's worth doing, it's just not where two-thirds of the problem lives.
The proof is your own numbers before and after, not a case study borrowed from someone else's demo.
Returns aren't a cost of doing business you shrug at. They're a fit problem in a logistics costume. Fix the fit, measure the fix where it shows up, in contribution margin, and the biggest line in your ops budget starts working for you instead of against you.