Cost Optimization
Underwrite Every AI Project in One Number
One question kills most bad AI projects before they start: what line does it move, and by how much?

One question kills most bad AI projects before anyone builds anything: what line does it move, and by how much?
Ask it out loud in the room and watch half the proposals go quiet. They were never attached to a number, only to a demo. Somebody saw a good screenshot, the word "AI" was in the deck, and it got a slot on the roadmap. That's how you end up in the 95%.
The number that boardrooms keep passing around is real. MIT's Project NANDA studied 300 public AI deployments and found that 95% of enterprise generative-AI pilots delivered no measurable P&L impact, against $30 to $40 billion in spend (MIT via Fortune, Aug 2025). Gartner got to the same place from another road: it now says at least 50% of generative-AI projects were abandoned after the proof-of-concept, and expects over 40% of the projects that let AI run tasks on its own to be cancelled by 2027 for the same reason, unclear business value (Gartner, Jun 2025). None of that means the technology is broken. It means most of it got pointed at the wrong problem and never wired to a line.
In apparel the lines are already drawn
You don't have to go looking for the number in a fashion brand. It's the return rate, and it's brutal. Apparel runs about 25% overall, 30 to 40% in some subcategories, against 14.8% across DTC as a whole. Two thirds of those returns, 67%, come down to size and fit, and 51% of Gen Z buy multiple sizes on purpose to send some back (Eightx; Richpanel).
Put dollars on it. At a $10M brand, a 25% return rate is roughly $2.5M in goods coming back through the door and $375K to $625K in processing alone, before you count the write-offs on what can't be resold (Eightx). Reverse logistics eats 8 to 15% of every order it touches. That's the boat you're already bailing.
Now the margin you're bailing it with. The median DTC brand books a healthy 60 to 70% gross margin and finishes at a 15 to 20% true contribution margin once every variable cost is in (Luca). Acquisition is going the wrong way underneath you: CAC is up 40 to 60% since 2023, and the average brand now loses about $29 on each new customer once returns and ad spend are counted, up from $9 a decade ago (Swell; Eightx). When the customer already costs more than the first order keeps, an AI project that doesn't touch a named line isn't neutral. It's a second hole in the same boat.
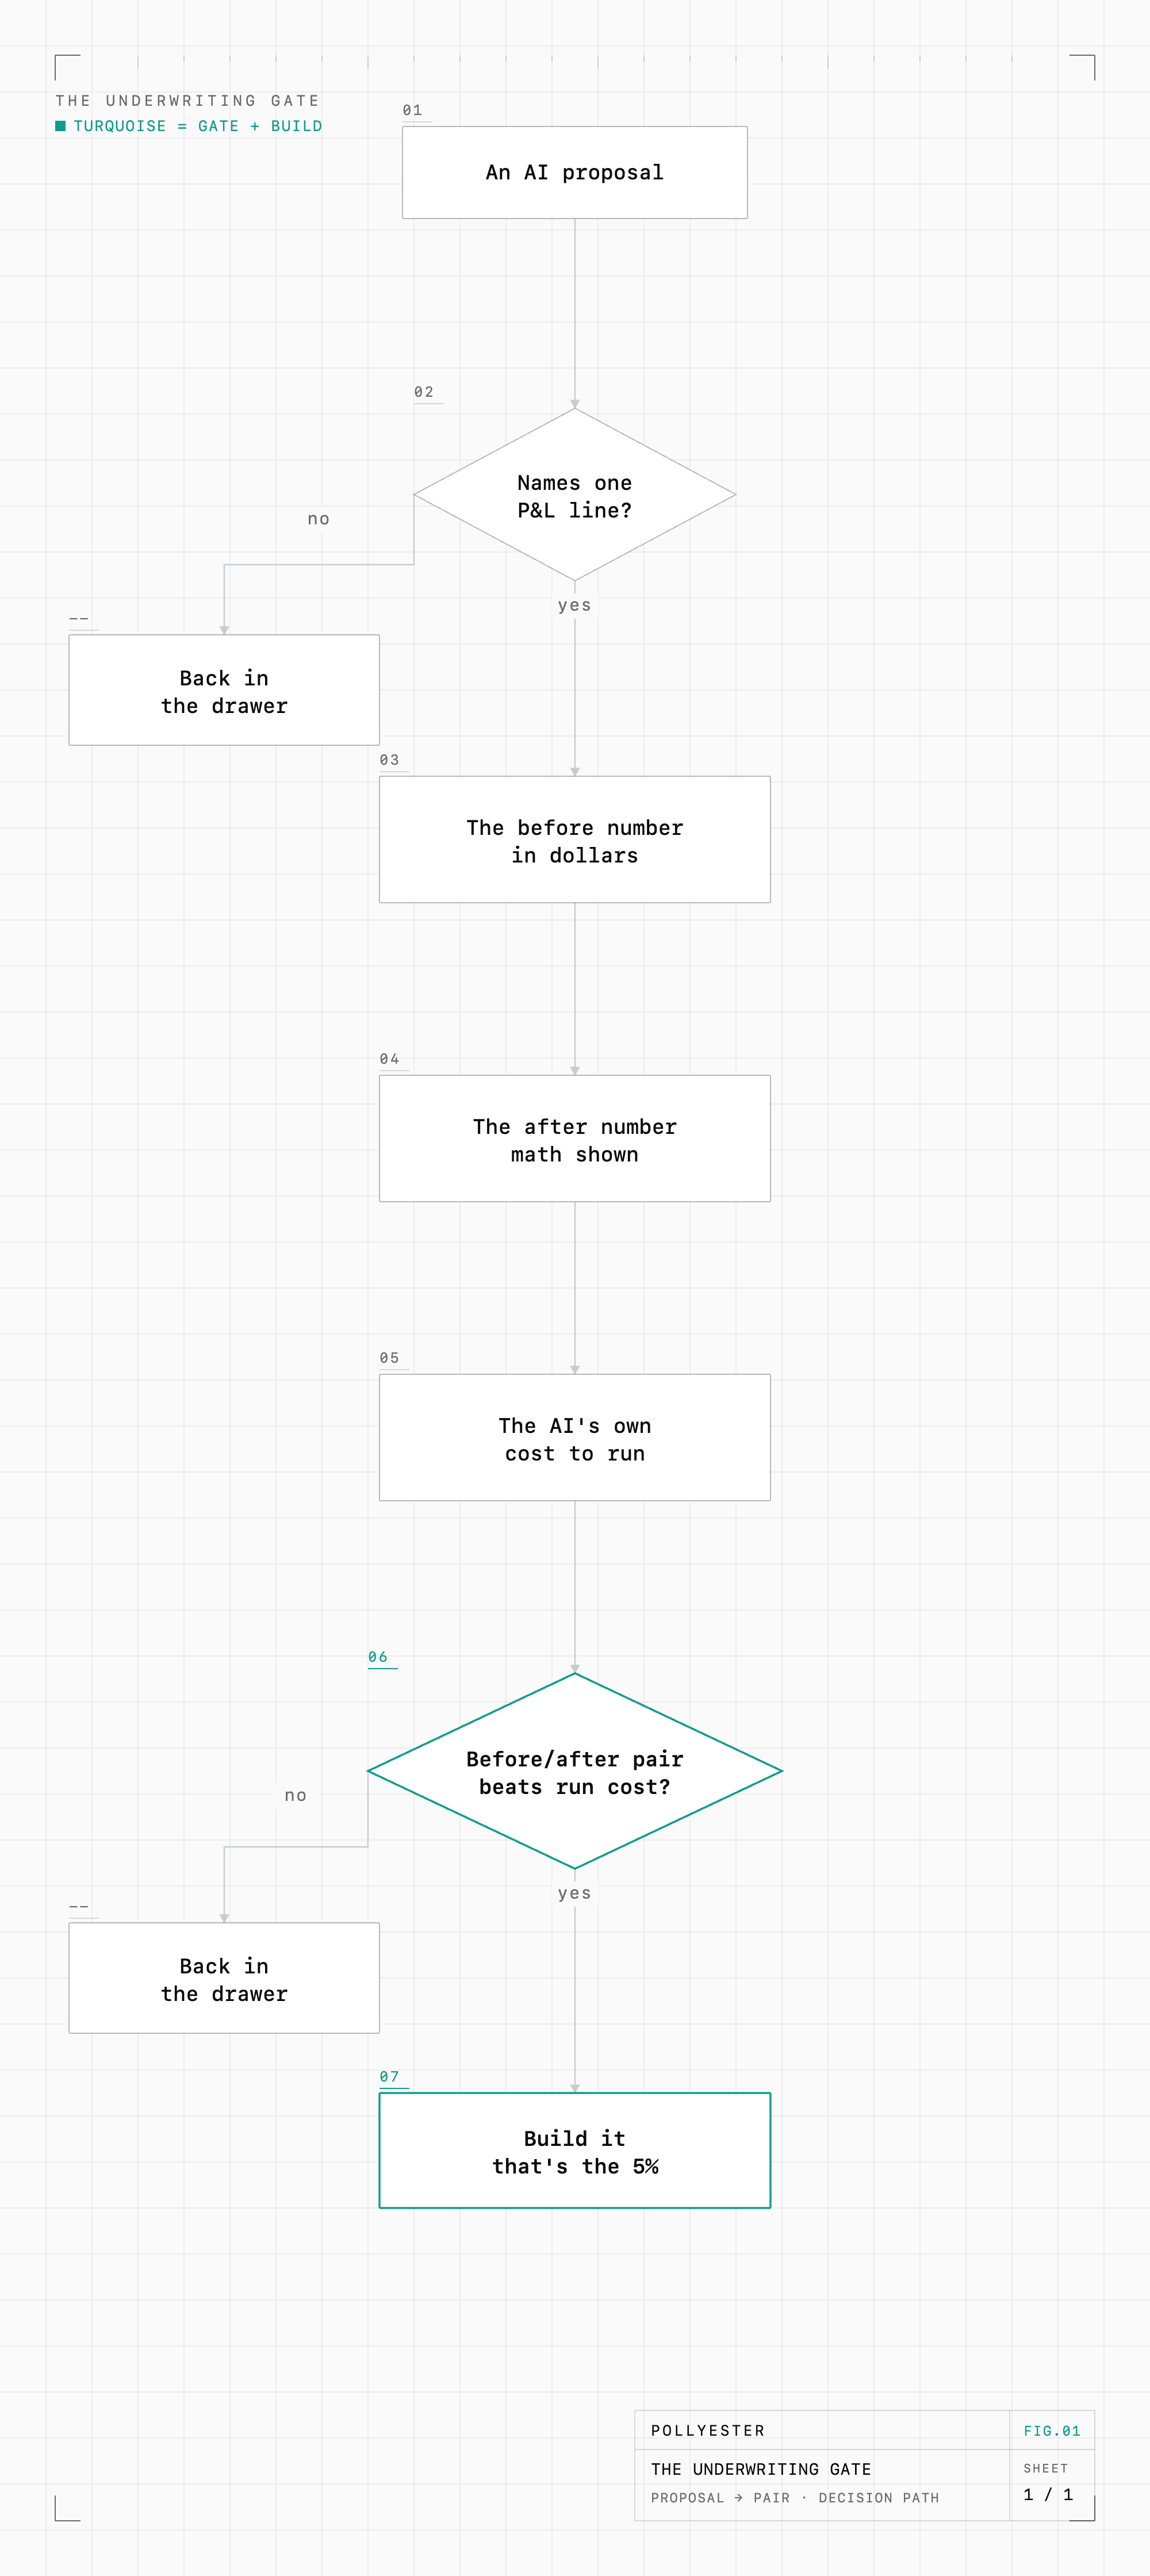
No pair of before-and-after numbers, no build. That's the whole gate.
Underwrite it like any other spend
So treat every AI initiative as a cost center until proven otherwise, the way you'd treat any spend that crosses your desk. You don't fund a new packaging vendor on vibes. You ask what it costs, what it saves, and what changes on the P&L. Hold AI to the same bar. Before anything gets built, it has to produce four things.
Name the line. One P&L line it moves, not a metric, a line. Return rate. Cost-to-serve. AOV. Refund leakage. If the honest answer is "engagement" or "add-to-cart," it hasn't cleared this question yet, it's just borrowed a step that sits upstream of the money.
The before number. Where that line sits today, in dollars. Not a percentage floating in a slide. $2.5M in returns. $500K in support labor. The current state, priced.
The after number. Where the line lands if the project works, with the math shown. Not "significantly lower." A figure you'd let someone hold you to.
The AI's own cost to run. What it costs to operate, every month, forever. This is the cost-to-serve nobody prices in, and we'll come back to why it's the one that bites.
No pair of before-and-after numbers, no build. That's the whole gate.
Work it through: AI fit prediction
Take the obvious apparel candidate, AI fit and size prediction, and run it through the gate instead of the demo.
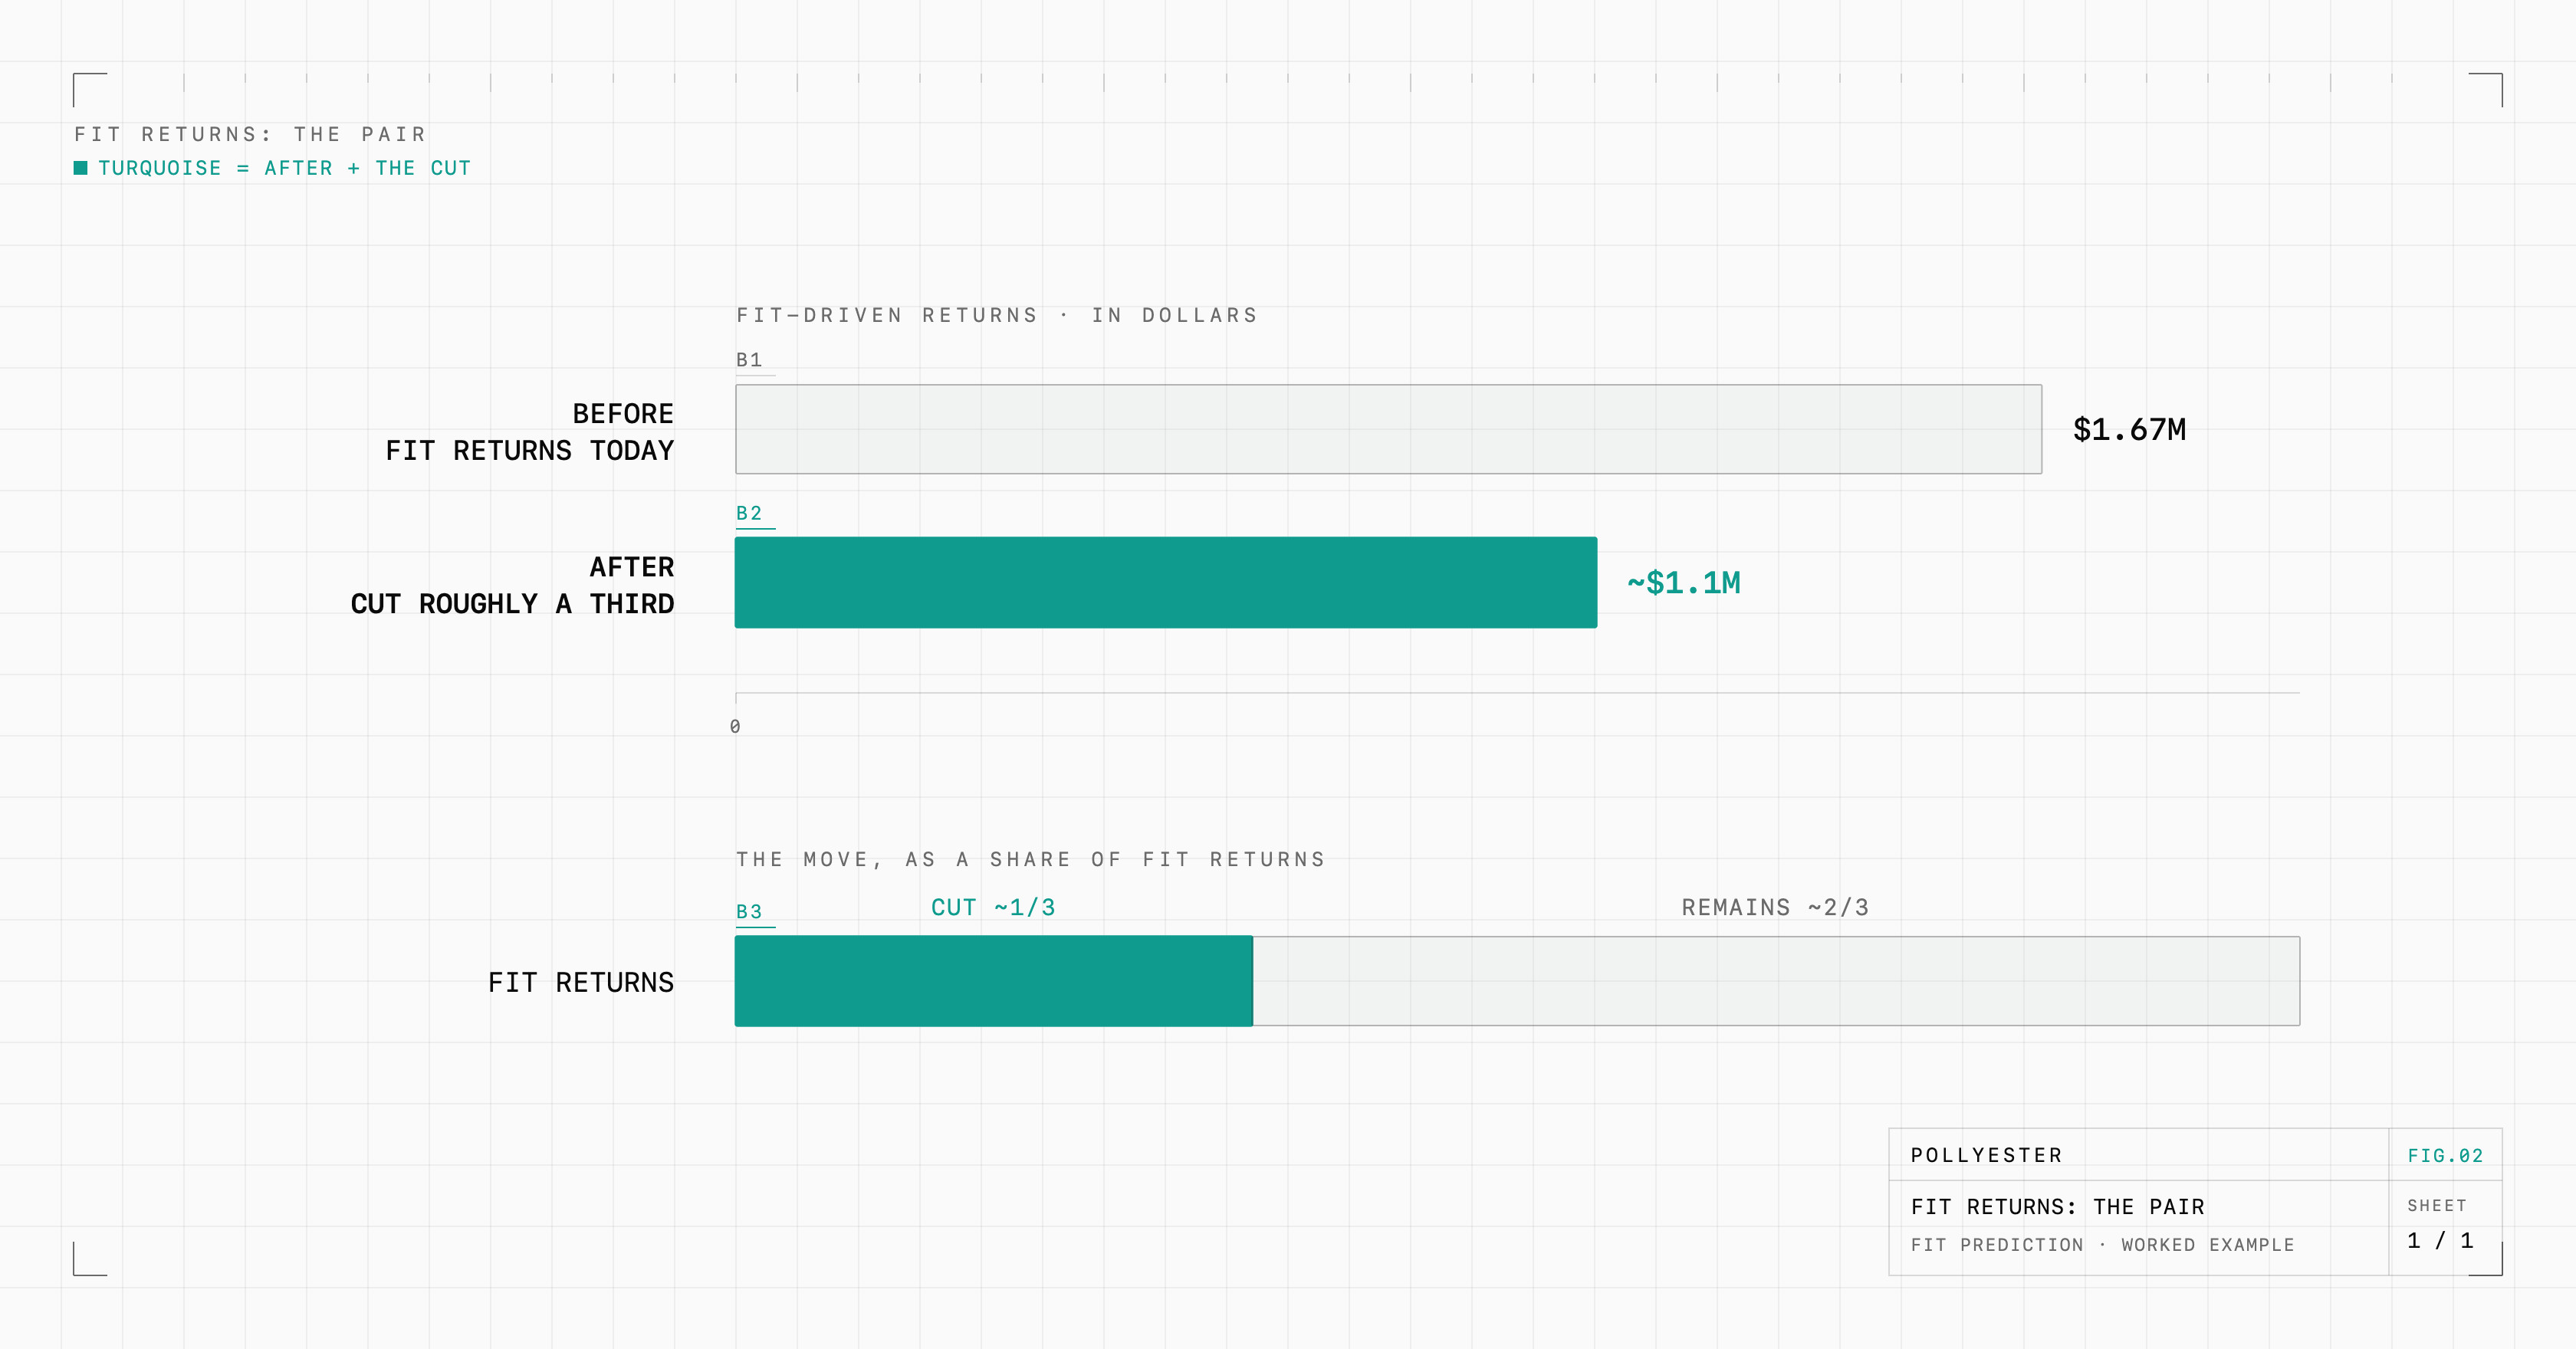
The line is return rate, and specifically the fit-driven slice of it. The before number: of that $2.5M in returns, two thirds are size and fit, so call it $1.67M in goods coming back for a reason the technology can actually address.
The after number is where you show your work. AI sizing and fit tools have cut fashion returns by up to 60% for the brands that deployed them well (Mirrorsize). Don't underwrite to the headline. Cut the fit-driven slice by a third and you keep roughly $550K of goods on the shelf instead of in a return bin, plus a real dent in that $375K to $625K processing bill. Now you have a pair. $1.67M in fit returns, cut to something near $1.1M, with six figures of processing that never happens.
Then the AI's own cost, priced honestly, and only then do you know if it clears.
And here's the trap the gate is built to catch. Underwrite that same tool against add-to-cart or conversion and you can get a win that loses money. A virtual try-on can lift conversion because it's fun to use, while the people it converts bought off a rendered image and send it back at a higher rate than your baseline. Conversion goes up, returns go up, and contribution margin goes down. That's a vanity win. It looks great in the quarterly review and costs you money every month. The gate catches it because you named the line as return rate, not add-to-cart, and the after number went the wrong way.
That's a vanity win. It looks great in the quarterly review and costs you money every month.
The plays that clear the gate are dull on purpose
The initiatives that survive this are rarely the ones with the best demo. They're the ones with a before-and-after you could defend to your CFO.
Return inspection, underwritten against refund leakage. Fraud drained $76.5 billion from US retail in 2025, and people are now using generative AI to fake damage photos for refunds (Fox News; PYMNTS). AI that checks returned goods against the claim attacks that line directly.
Product recommendations, underwritten against AOV and revenue per session. Done right they can drive up to 31% of revenue, and a Forrester study of one personalization deployment found a 446% three-year return with payback under six months (Envive; via EComposer).
Support automation, underwritten against cost-to-serve. Fewer tickets touched by a person, priced per ticket, is a line you can watch move week over week.
Notice what the winners share. This is also what MIT found inside the 5% that worked: they aimed AI at back-office operations, not the marketing budget — where the money in the business actually is — and they bought tools from outside specialists, which succeeded twice as often as internal builds (MIT via Forbes). Unglamorous, close to the operation, attached to a line.
Why the fourth question is the one that bites
That last gate, the AI's own running cost, is where quiet projects die. Sticker prices are falling and bills are still climbing. The price per unit of AI usage dropped about 67% year over year while the bills tripled, because the multi-step AI everyone wants burns 5 to 30 times more usage per task than a simple question (NavyaAI). Running the model is only about 20% of the true cost of ownership. Uber's budget for the year was gone by April (Optimum Partners). And left unwatched, these systems fail expensively: one ecommerce chatbot stacked coupons into negative prices and pushed through 2,400 orders at a loss north of $150K before anyone noticed (InspectAgents).
A recommendation engine that lifts AOV but costs more to run than the margin it adds is a net loss with a nice dashboard. You only see it if the fourth number is on the page from the start. This is where the discipline of cost optimization earns its keep, and it's a place we've stood, on the operator side of that invoice.
The gate isn't anti-AI
It's the opposite. This is what lets you say yes and mean it.
Most of what's marketed as AI won't move your business, and the tool that works looks identical to the one that doesn't right up until the bill arrives. The gate is how you tell them apart before you've spent the money. Name the line, put the before number on it, show the after with real math, and price what the thing costs to run. Everything that produces that pair is worth a serious look. The rest goes back in the drawer.
Build only what produces the pair. That's the 5%.