Get Chosen
Core Web Vitals Is the Cheapest Conversion Lever You're Skipping
Before you buy a personalization platform, check your load time. It's probably costing you more sales than any tool will add back.

Open your own product page on your phone, on cellular data, away from the office wifi. Time how long until your product actually shows up on screen. That number is where a lot of your conversion problem lives, and no six-figure tool is going to fix it, because the tool isn't what's slowing the page down.
Most brands never run that test. Speed sits with engineering and conversion sits with growth, so the two teams look at different dashboards, own different budgets, and meet mostly in a status update where nobody says the words "our site is slow." The cheapest lever you have falls out of the plan every quarter, and the conversion conversation defaults to buying software instead.
The math is blunt
Every extra second your page takes to load costs you roughly 7% of your conversions (Born Digital, Magnet). That number has held up across catalogs and price points for years, and it's 7% off traffic you already paid to bring in.
Run it the other direction and it reads the same. Clear the Core Web Vitals bar and conversion tends to move somewhere between 5% and 33%, depending on how far below the line you started (Born Digital). Wide range, but the floor is already worth more than most of the tools you're being pitched.
Now put that against the category you're in. Food and beverage runs one of the highest conversion rates in retail, up to 6.17% by common benchmarks (Smart Insights). People know what a snack, a coffee, or a supplement costs, so they don't need to be convinced, they need to be able to check out. A slow page in a category that already converts is money sitting on the table for no reason. And the category keeps getting bigger under you: online grocery hit about $220B in 2025 (Shopify, via industry-verticals brief). More traffic is coming, and every point of speed you fix now compounds against all of it.
A slow page in a category that already converts is money sitting on the table for no reason.
What Core Web Vitals actually asks of you
Google grades three things, and each one is a plain question about the customer's experience.
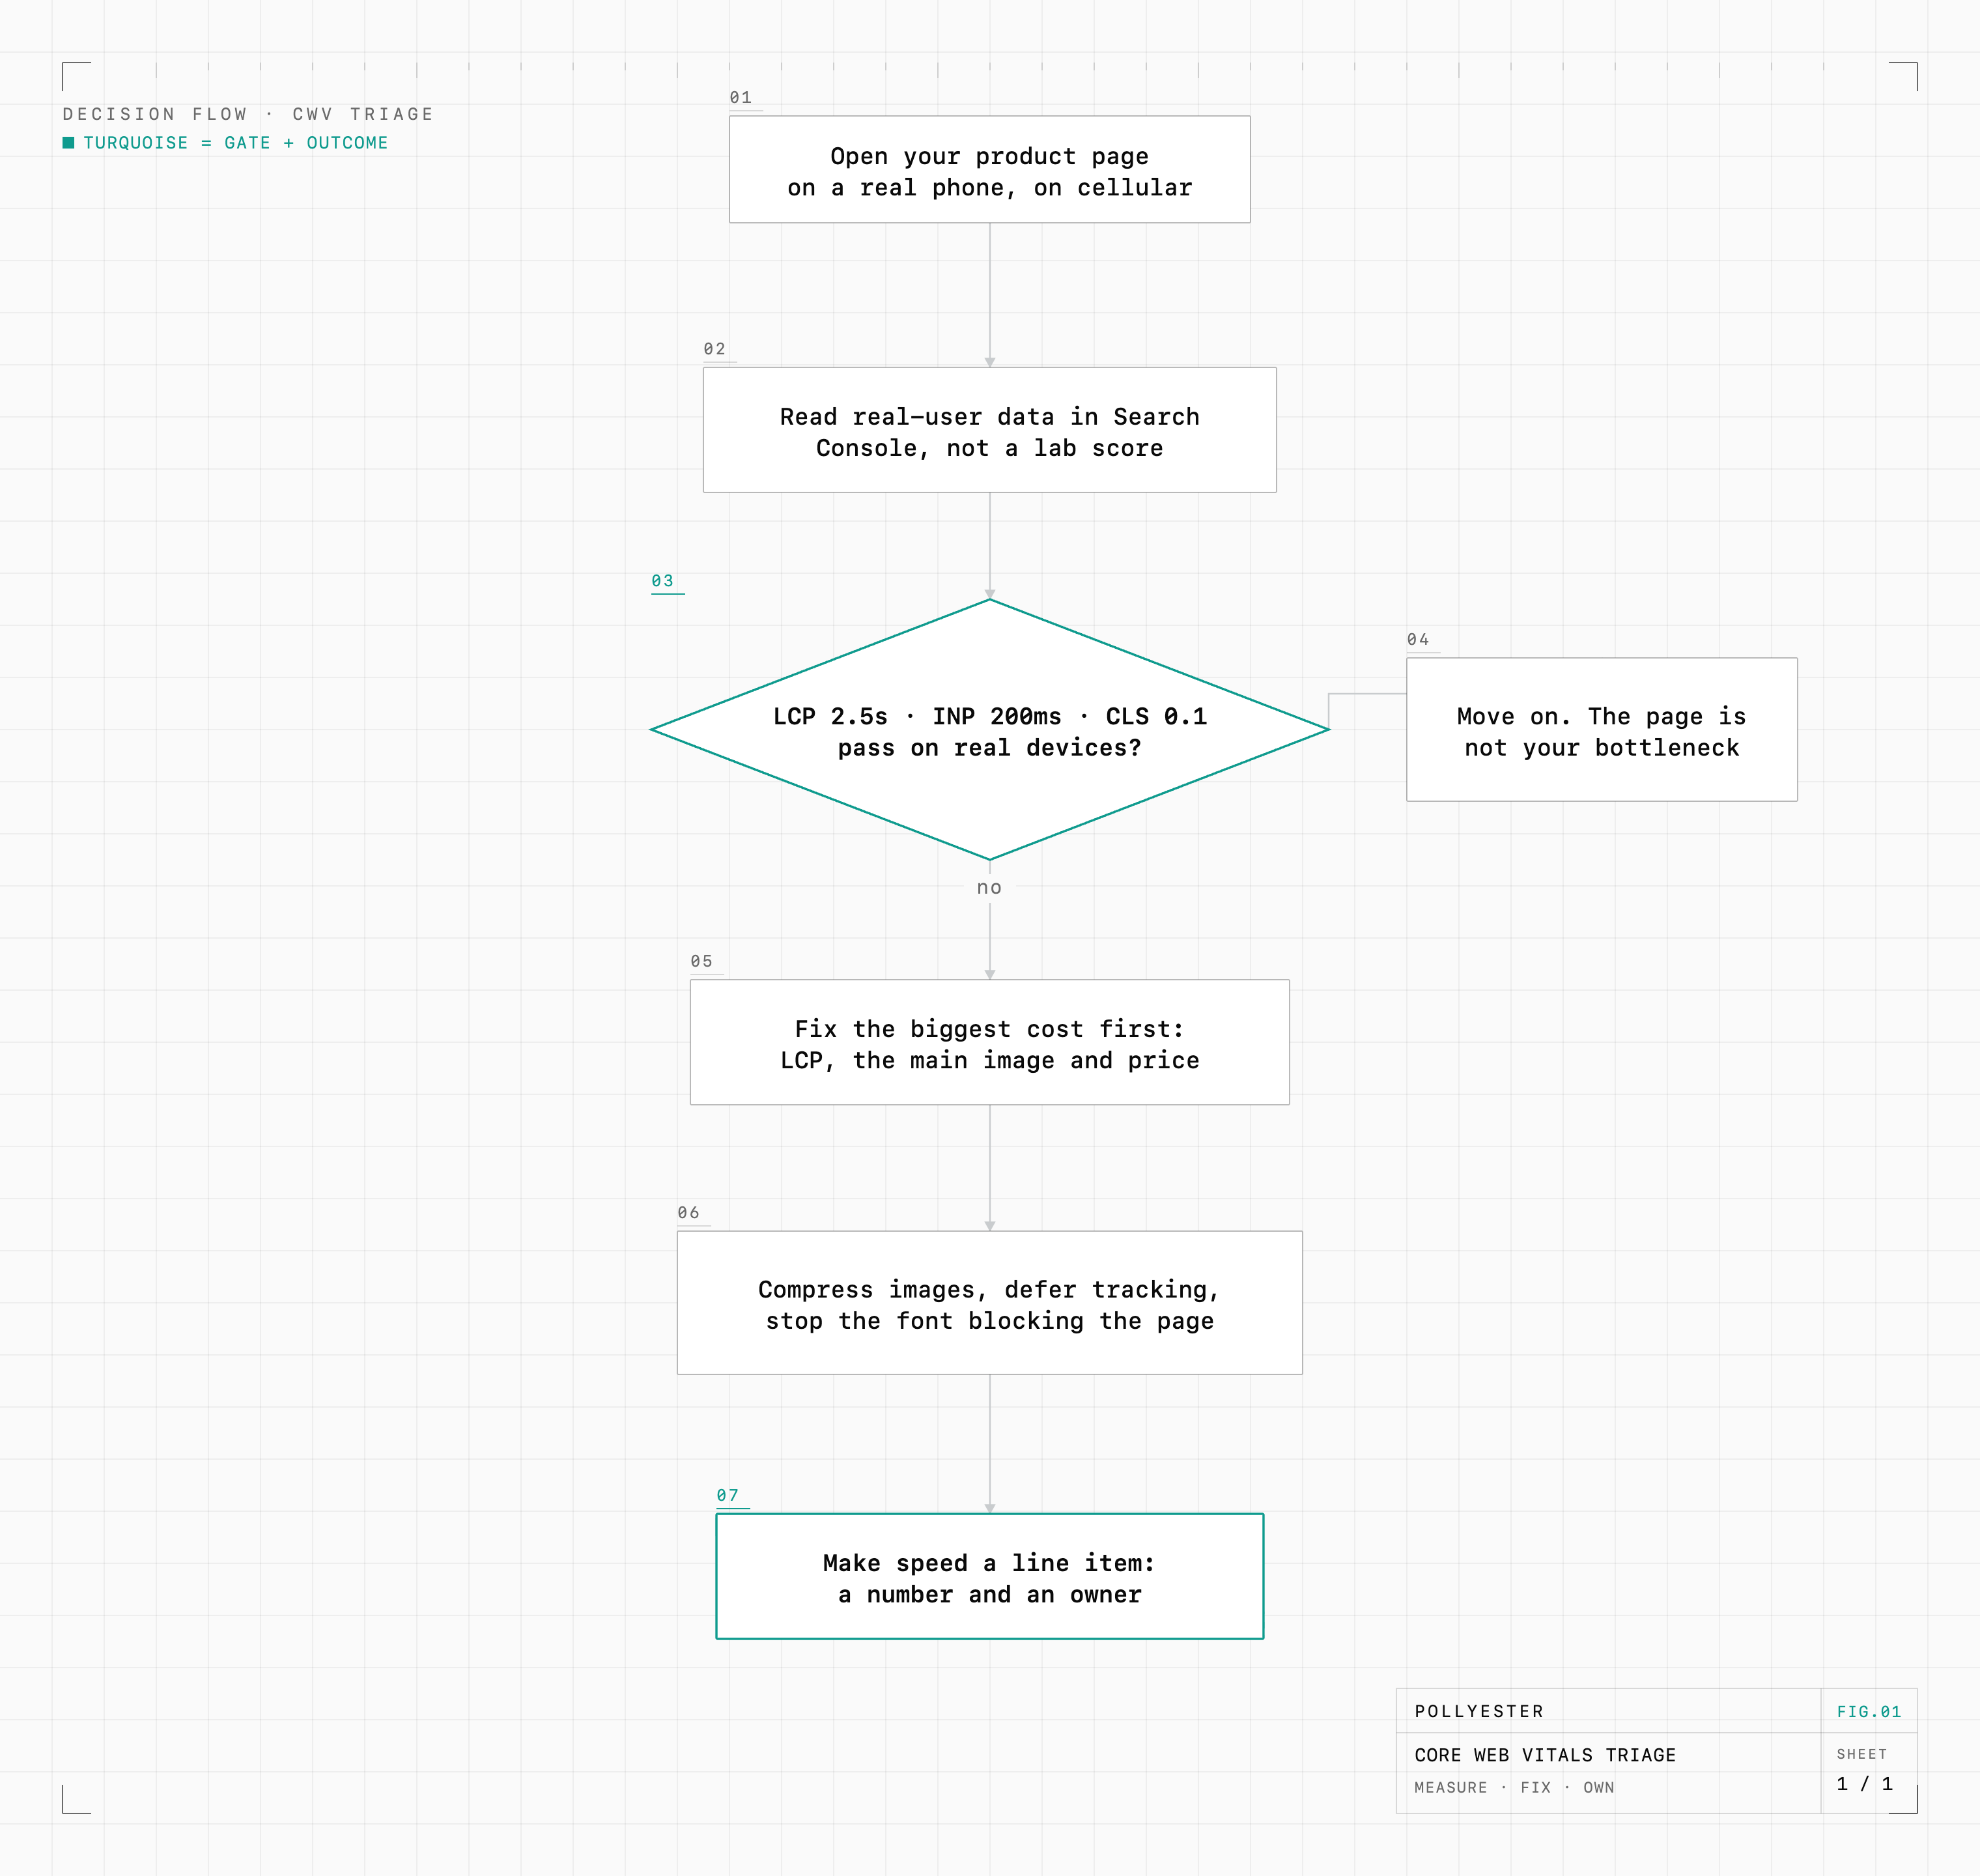
How fast does the main thing load? Google calls this one Largest Contentful Paint, and the bar is 2.5 seconds. From the moment someone taps your link, that's how long until the product image and the price are actually on their screen. Under 2.5 seconds you pass, and slower than that you lose a chunk of people before the page finishes.
How fast does the page answer when they tap? Google calls this Interaction to Next Paint, and the bar is 200 milliseconds. Someone hits add-to-cart or opens a size option, and the page answers right away instead of hanging for a beat. That hang is where people decide it's broken and leave.
Does the page hold still while it loads? This one's Cumulative Layout Shift, and the bar is 0.1. The page shouldn't jump around as images and banners load in, so nobody taps the wrong thing or loses their place. You've felt it yourself, reaching for a button that slid out from under your thumb.
That's the whole test. Three questions, three numbers, and none of it requires a new platform.
That's the whole test. Three questions, three numbers, and none of it requires a new platform.
Measure what your customers feel, not what your laptop sees
Here's the trap that keeps brands stuck. Someone on the team runs a speed test from a fast laptop on office fiber, sees a green score, and calls it done. That's a lab test, and it flatters you. Your customers aren't on office fiber. They're on a three-year-old phone on a spotty cell connection in a parking lot.
The number that matters is what real people on real devices actually experienced on your site. Google collects it, uses it to rank you, and shows it back to you in Search Console for free. Start there. If the lab score is green and the real-world number is red, believe the real-world number, because that's your customer.
Then fix in order of what's costing you the most. Usually that's the main image and price loading too slowly, because that's what sends people away before they've seen anything. The fixes are dull: big images nobody compressed, too much tracking and widget code loading ahead of your product, a font file that holds the whole page back from showing. The clean product data you want anyway for AI shopping tends to sit right next to this work, since a page a machine reads fast is a page a person loads fast too.
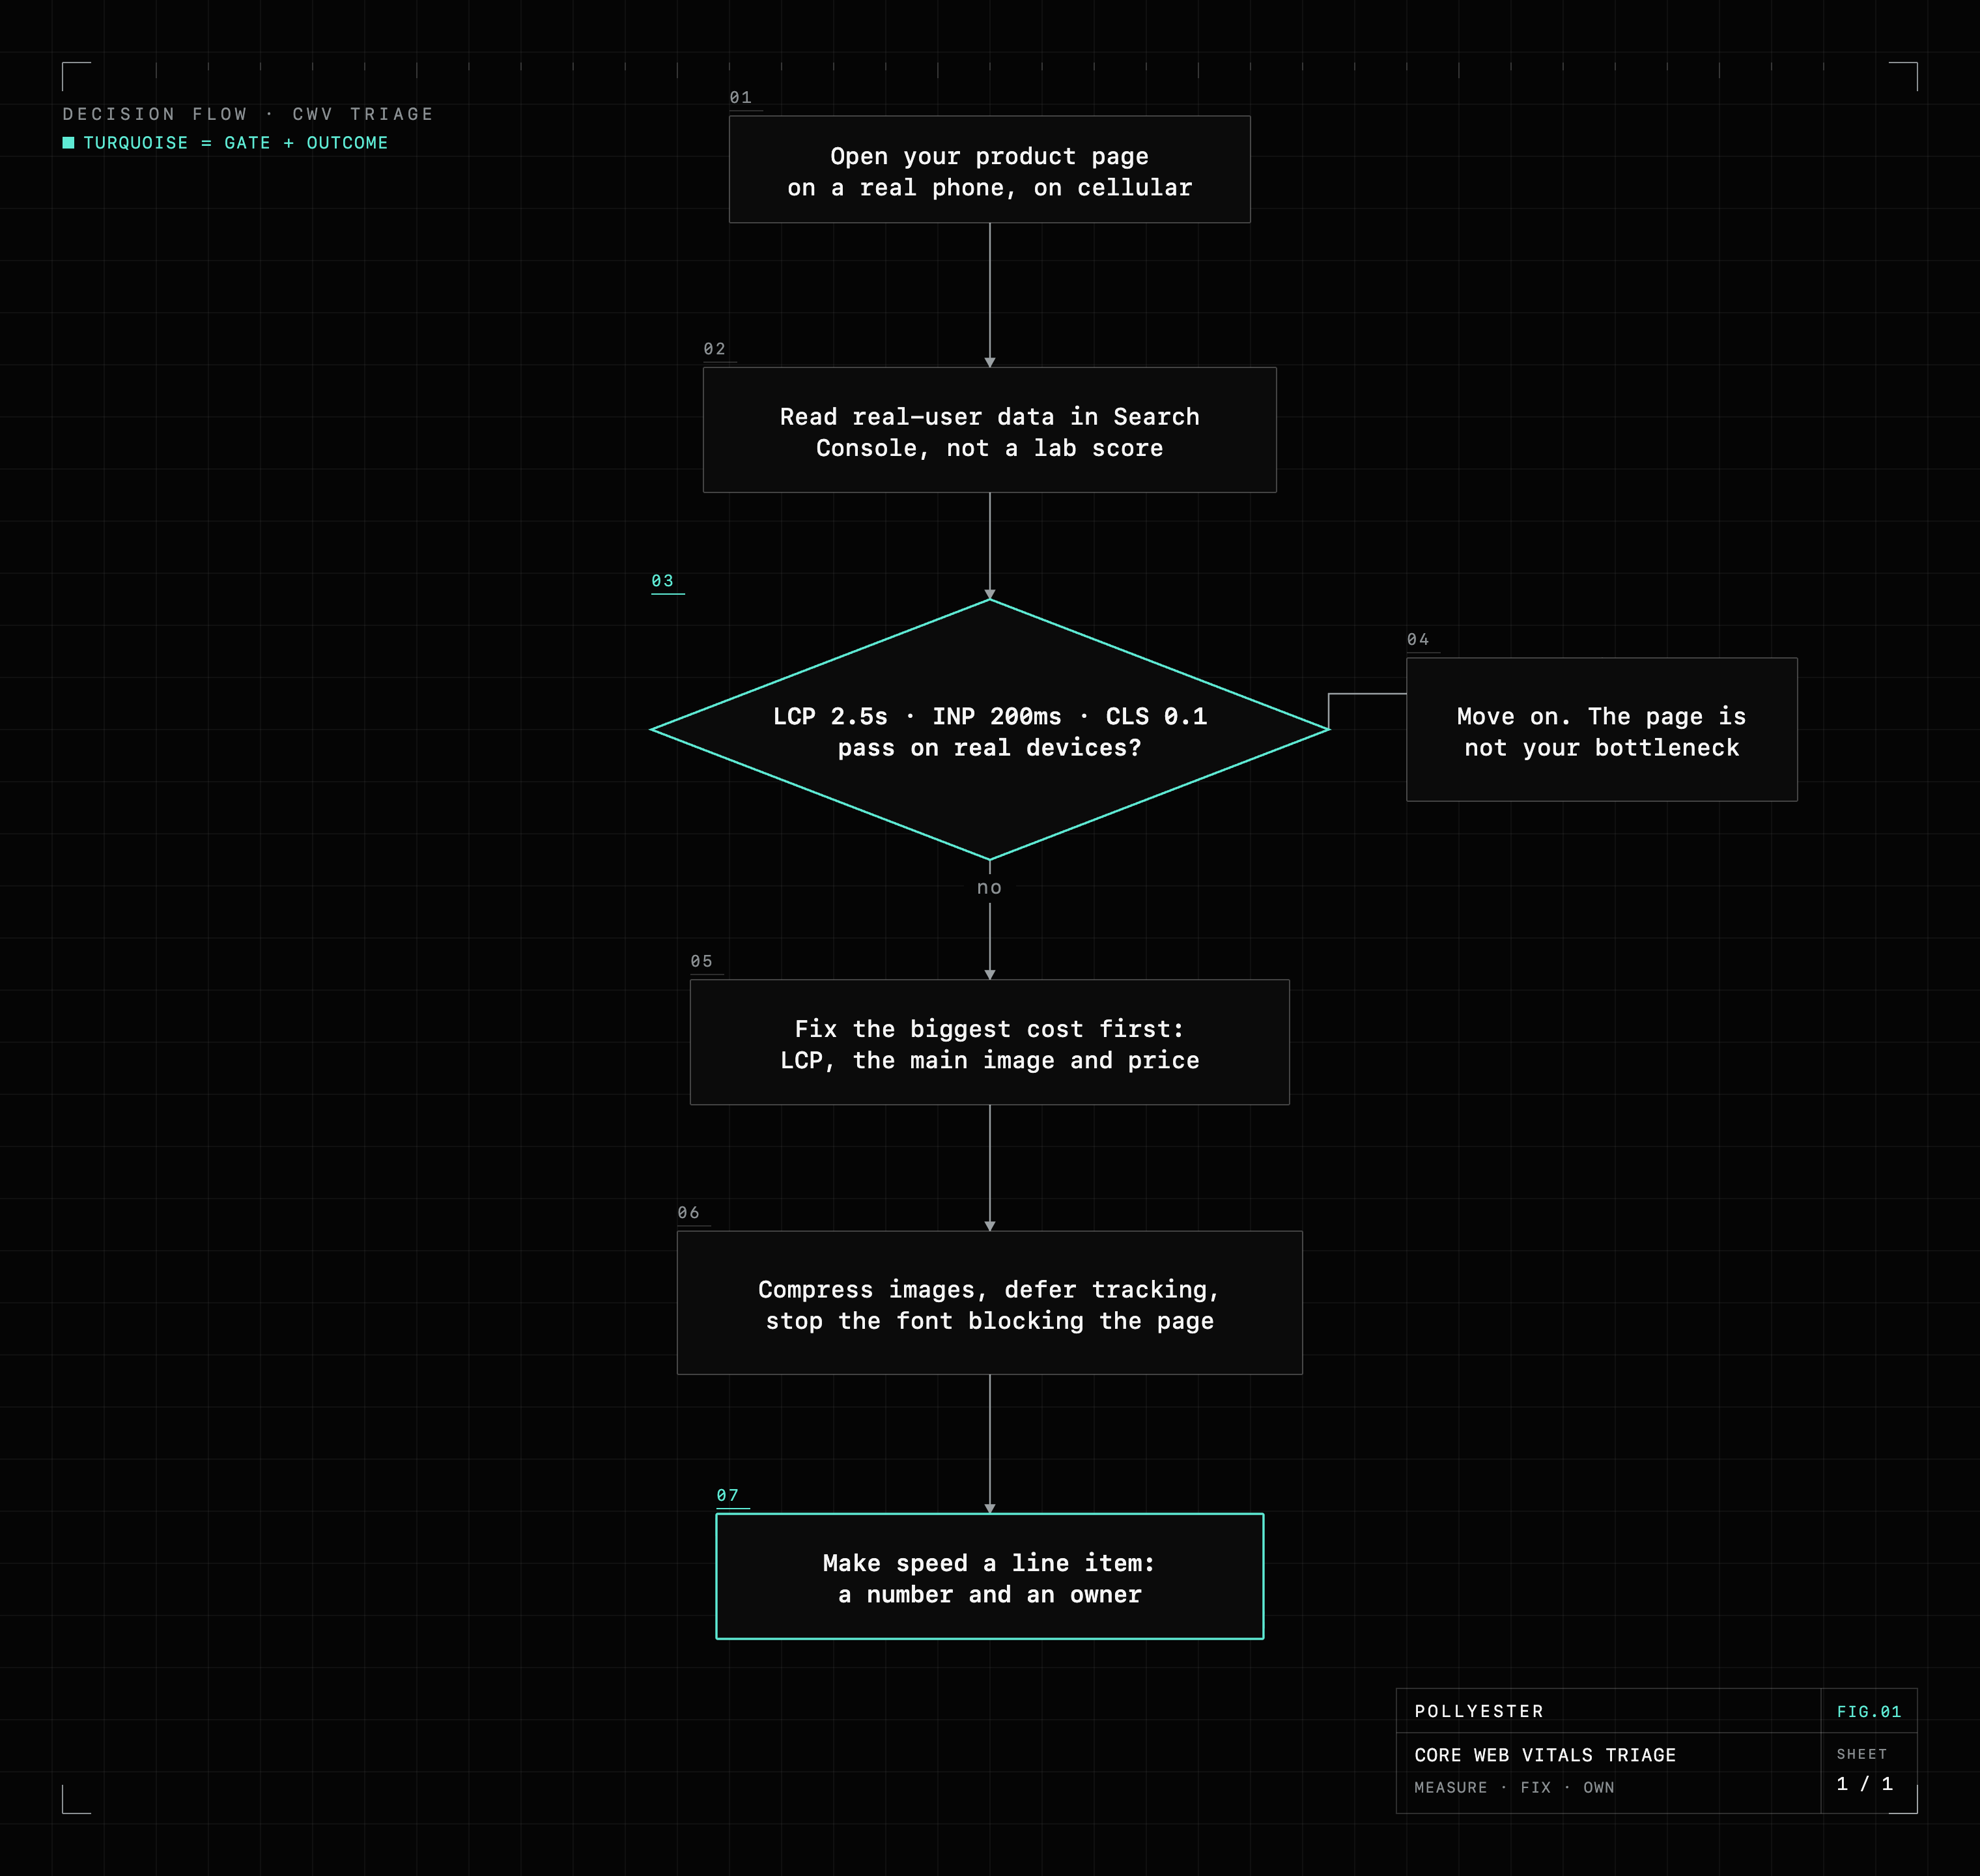
You don't need to know how any of that gets done. You need to make speed a line item in the conversion plan, with a number and an owner, the same way you track return rate or CAC.
What it's worth, in dollars
Skip the vanity numbers. Here's the only math that matters.
Take a brand doing $20M a year online at a 2.0% conversion rate. Move that to 2.5% and you're at $25M on the exact same traffic. Five million dollars a year. No new customers acquired, no new ad spend, no new tool subscription. Same store, same visitors, a faster page.
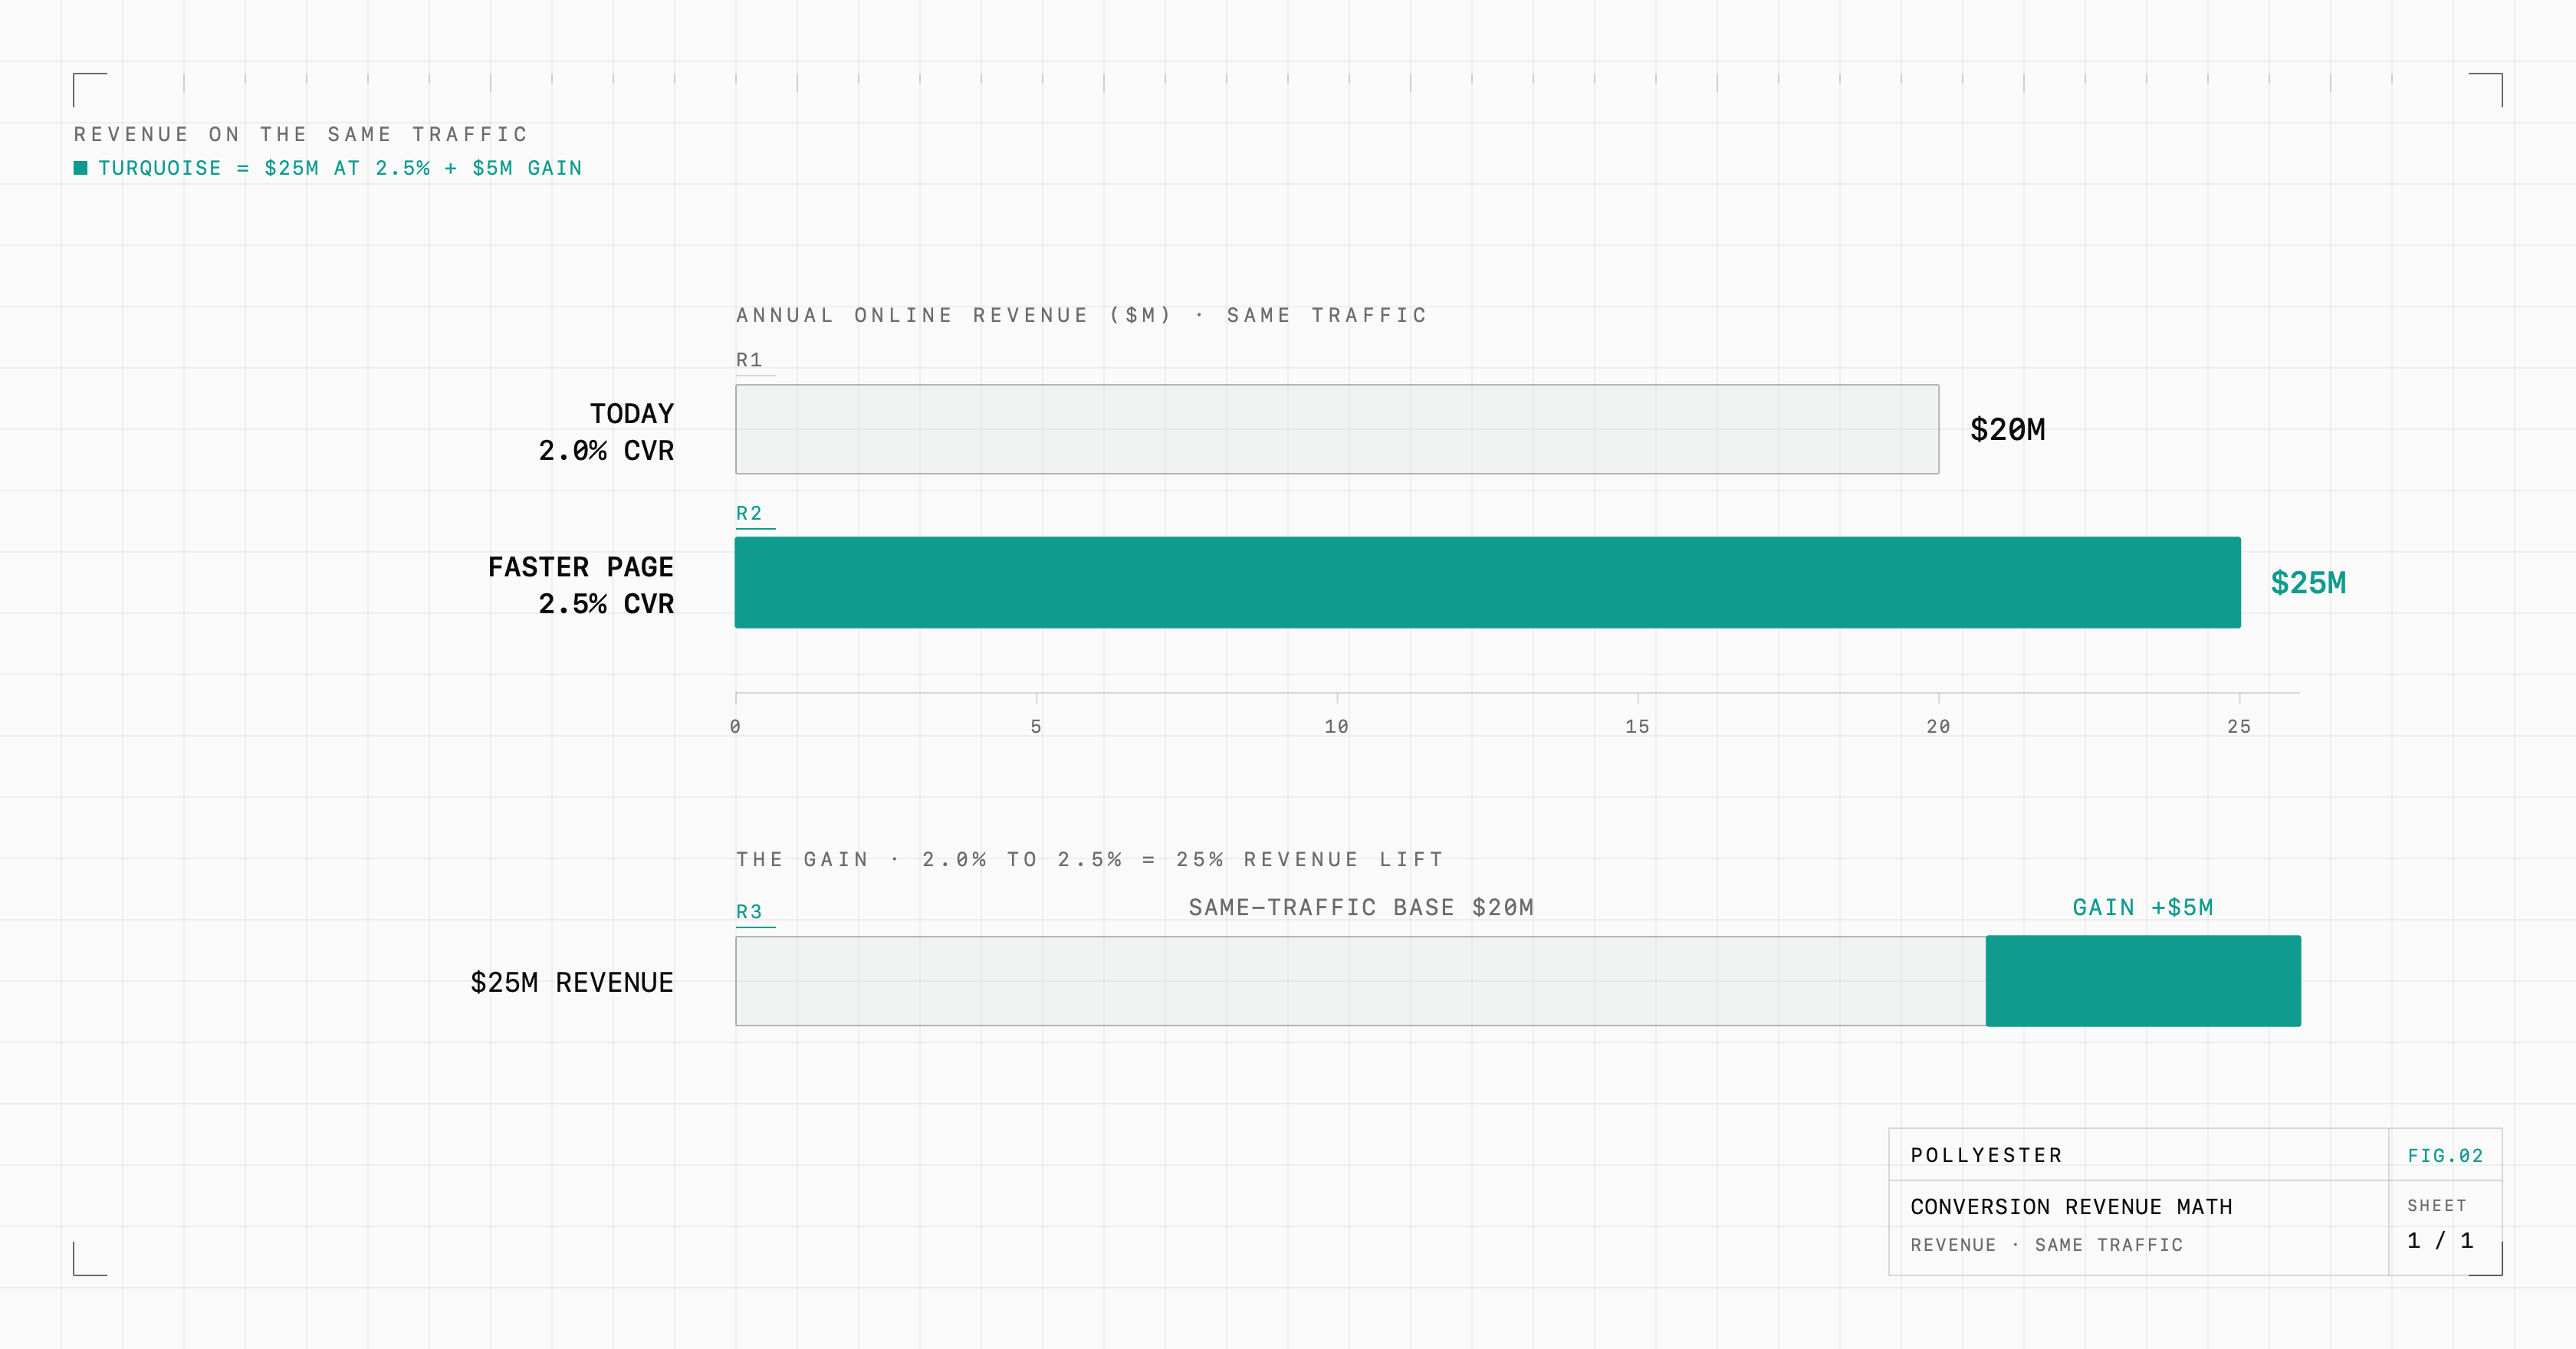
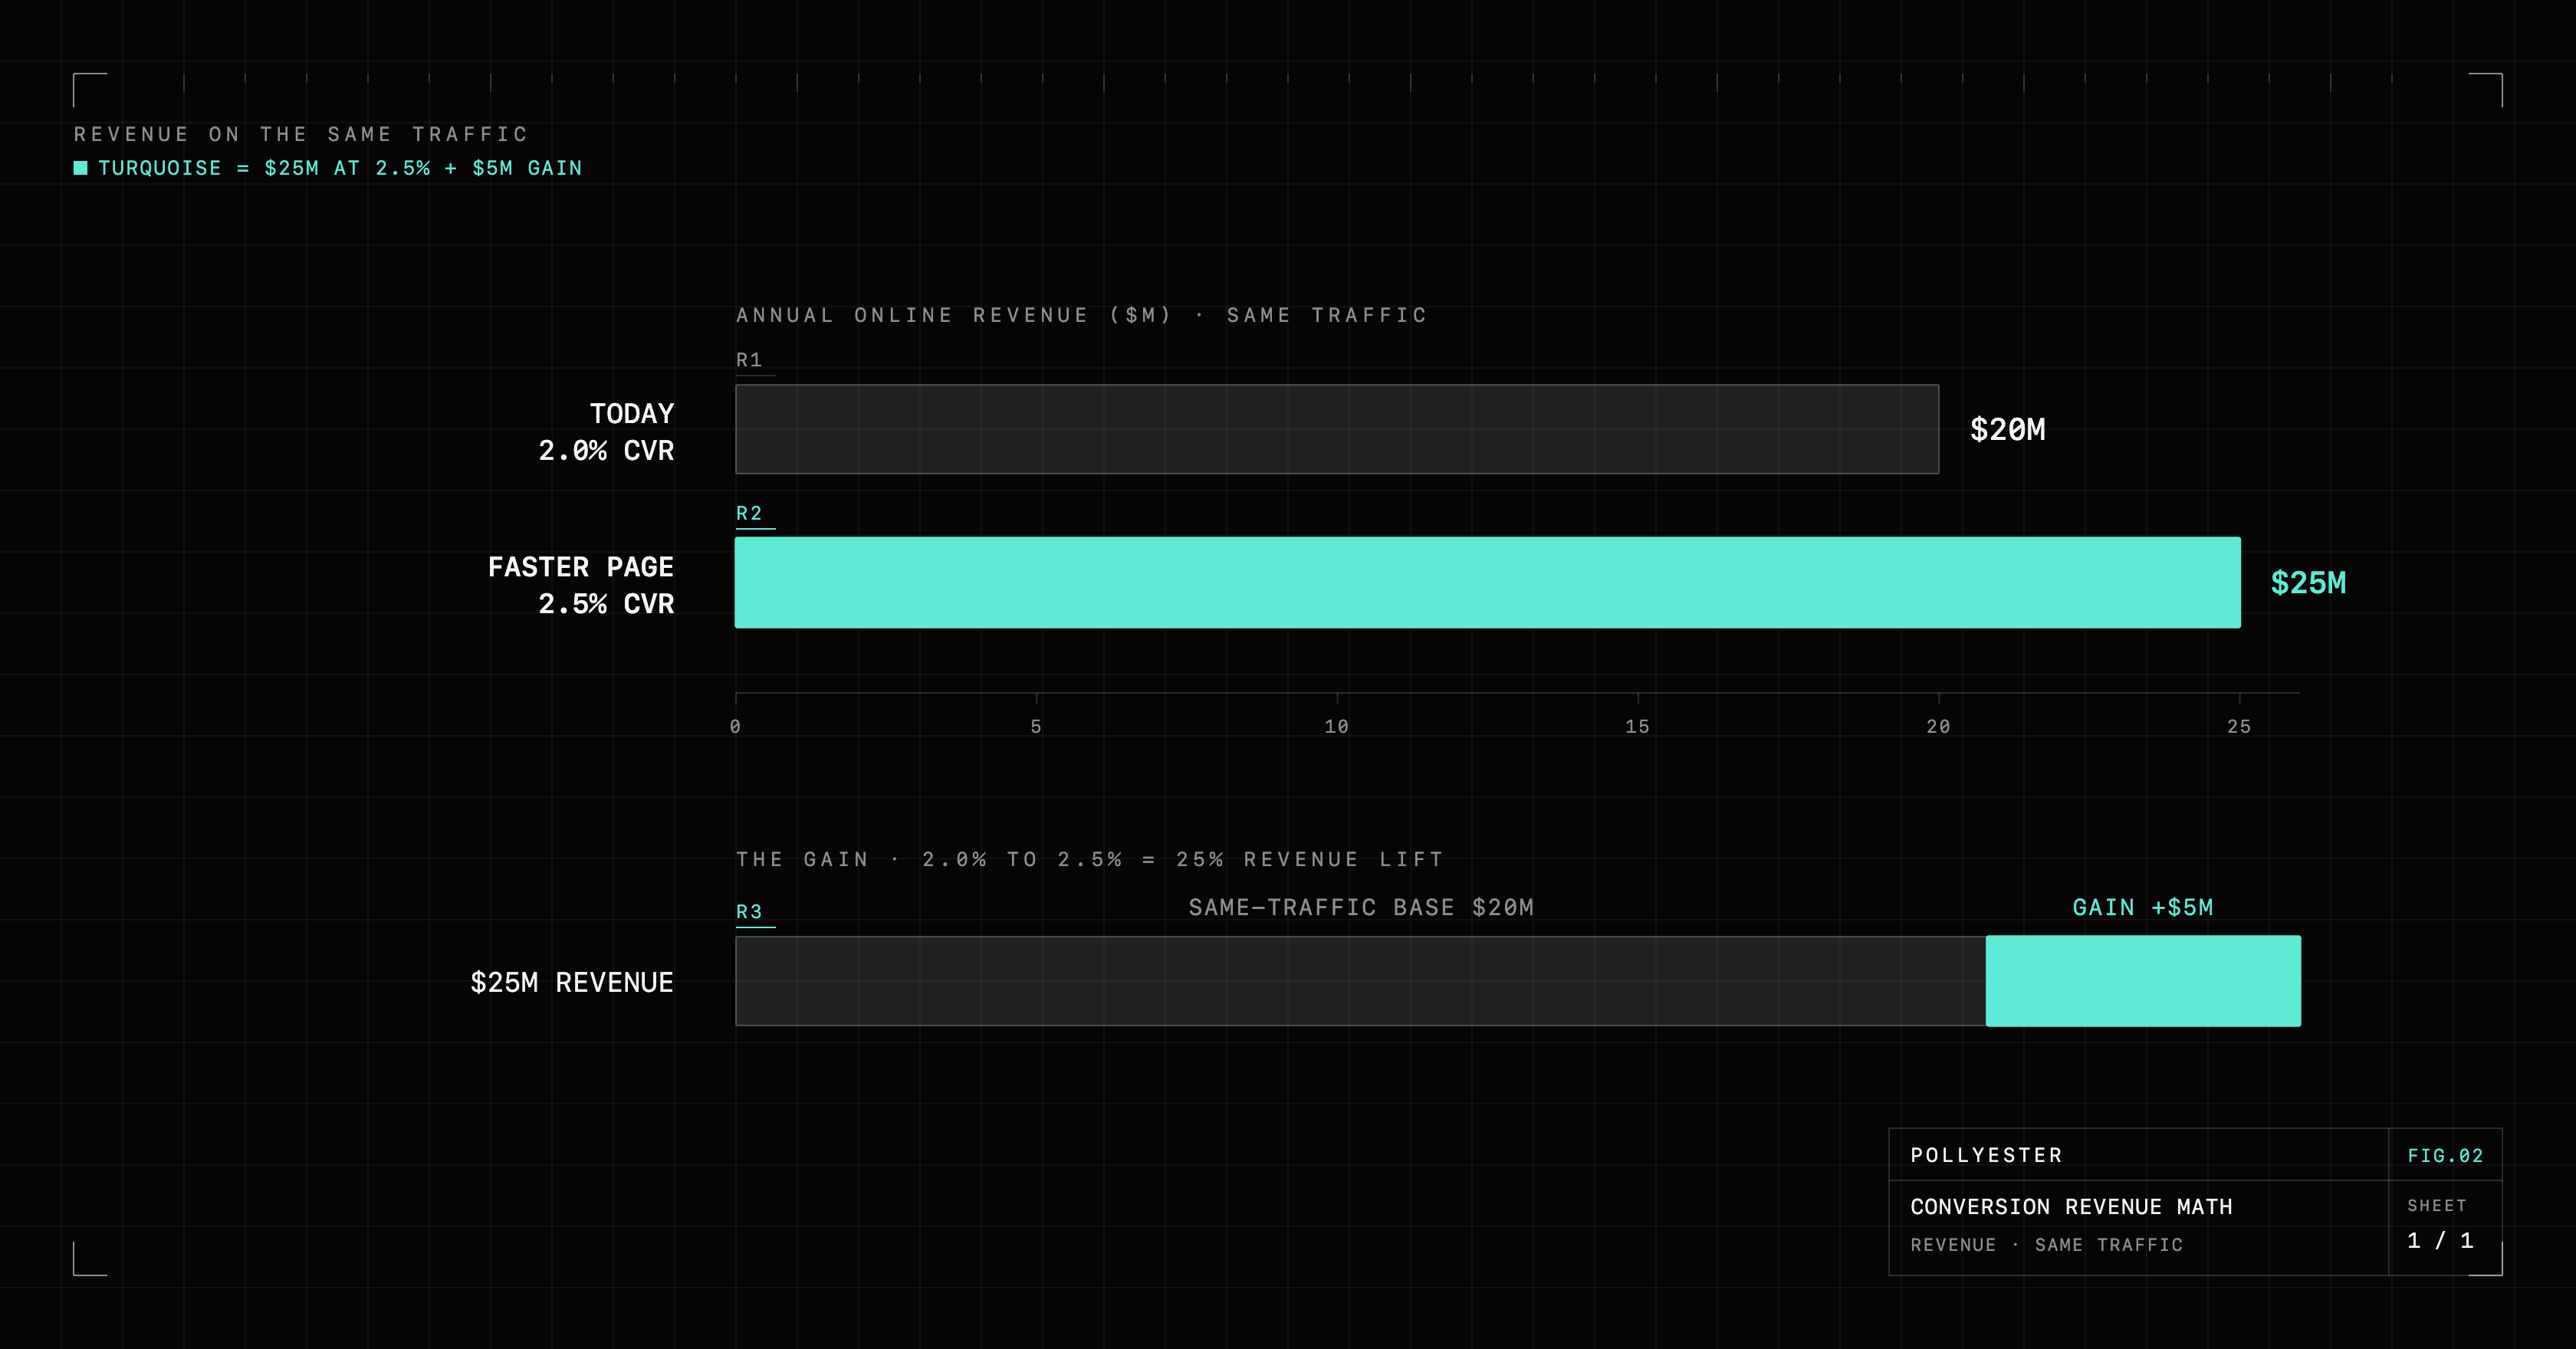
A jump from 2.0% to 2.5% is a 25% revenue lift on traffic you already have — that's just the arithmetic, half a point over a 2.0% base, the same math as the $20M to $25M above. A personalization platform might get you part of the way there, after a six-figure contract, a multi-month build, and an ongoing license. Clearing Core Web Vitals is a change your existing site can make in weeks, and it's often the reason the platform looked necessary in the first place. The page was slow, conversion was soft, and the pitch was to buy your way out of it.
The lever nobody's competing for
The reason this stays underpriced is the same reason it works. It doesn't make a good screenshot. There's nothing to demo in a board meeting and no logo to add to the stack, so it never gets the attention a new platform does. It's compression, cleanup, and a few settings, and it moves the number more reliably than most of what gets sold as a growth initiative.
So run the test on your phone first. Fix the speed. Then look at your conversion rate again and decide whether you even need the platform. A lot of the time, you won't.