Grow the Customer
'487% Retention Growth' and Other Numbers No Operator Would Recognize
A field guide to reading fake predictive-churn case studies, and what a real retention number looks like.

A field guide to reading fake predictive-churn case studies, and what a real retention number looks like.
Search "predictive churn DTC" and near the top you'll find "487% retention growth." Retention is the share of customers who come back, so it caps at 100%. No P&L anywhere grows it 487%.
That's not a typo or rounding. It's a shape someone invented to impress a reader who won't do the arithmetic. The piece it comes from, a D2C Times post on predictive churn, is a clean example of a whole genre now clogging the results for anyone shopping for a retention vendor. If you're a supplements brand being walked through case studies with heroic percentages and brand names you can half-recognize, learn to read them the way you'd read a P&L someone slid across the table. The tells are all there.
The tells
Start with the denominators, because there aren't any. Take the headline claims from that one piece: 487% retention growth, churn cut 73% in six months. Each one is a percentage floating free of the thing it's a percentage of. Cut 73% off what churn rate, on what group of customers, measured against what? A real retention number drags its denominator behind it, because the denominator is where the money is. Repeat rate went from 28% to 34% on the Q1 cohort. Monthly subscription churn dropped from 6% to 5%. Those are ugly and specific, and specificity is the thing fiction can't fake without getting caught.
Then there are the brands. A good case study names a company you can go find, with a person who'll take a reference call. The content-farm version names a brand that returns nothing when you search it, or no brand at all, just "a leading DTC skincare company." A brand nobody can call is a brand nobody can check.
There's a subtler tell, and it catches good operators. A case study brags that the customers its model saved had much higher lifetime value. Of course they did. You measured the customers who stayed. The ones the model flagged and lost aren't in that average. That's not a result, it's the definition of the group doing the work. You'd get the same glow by crediting your win-back flow for every customer who was never going to leave in the first place.
A real retention number drags its denominator behind it, because the denominator is where the money is.
Why "91% accuracy" is the giveaway
The one that should stop you cold is "91% prediction accuracy," in that same piece, attributed to tracking customers' "social media activity and life events."
Two problems, and the first is math. Churn is a rare event. If 8% of your customers lapse in a given window, a model that predicts "nobody churns" is right 92% of the time and useless. Accuracy rewards the model for the thing that was already going to happen, so "91% accuracy" isn't good, it's below the do-nothing baseline. Anyone who had built one of these would never lead with it. What matters is whether the model finds the people about to leave without crying wolf on everyone else. In plain terms: of the customers it flagged as at-risk, how many really were, and of the customers who left, how many did it catch. Those are harder to say out loud and impossible to inflate.
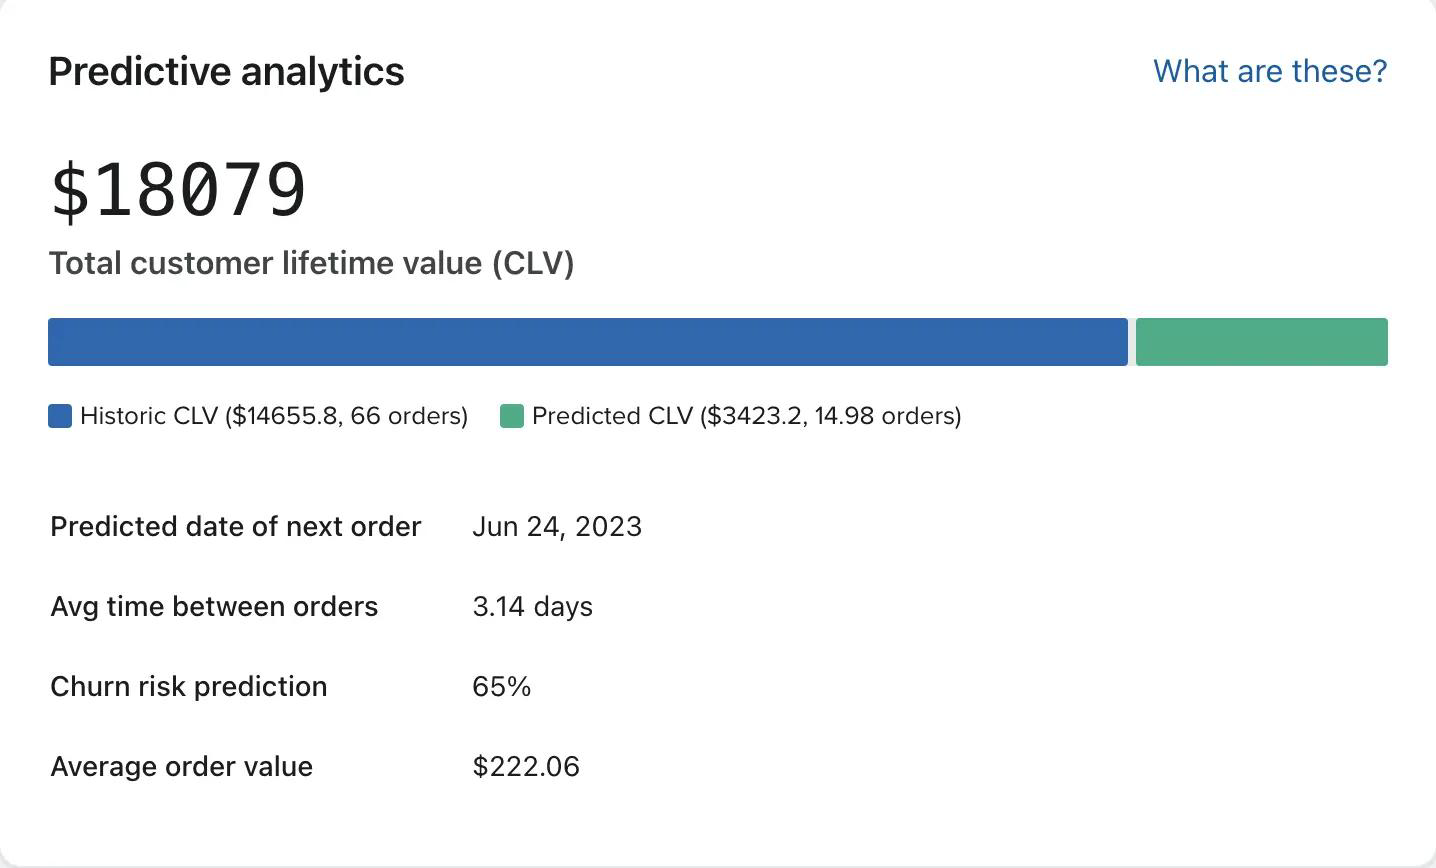
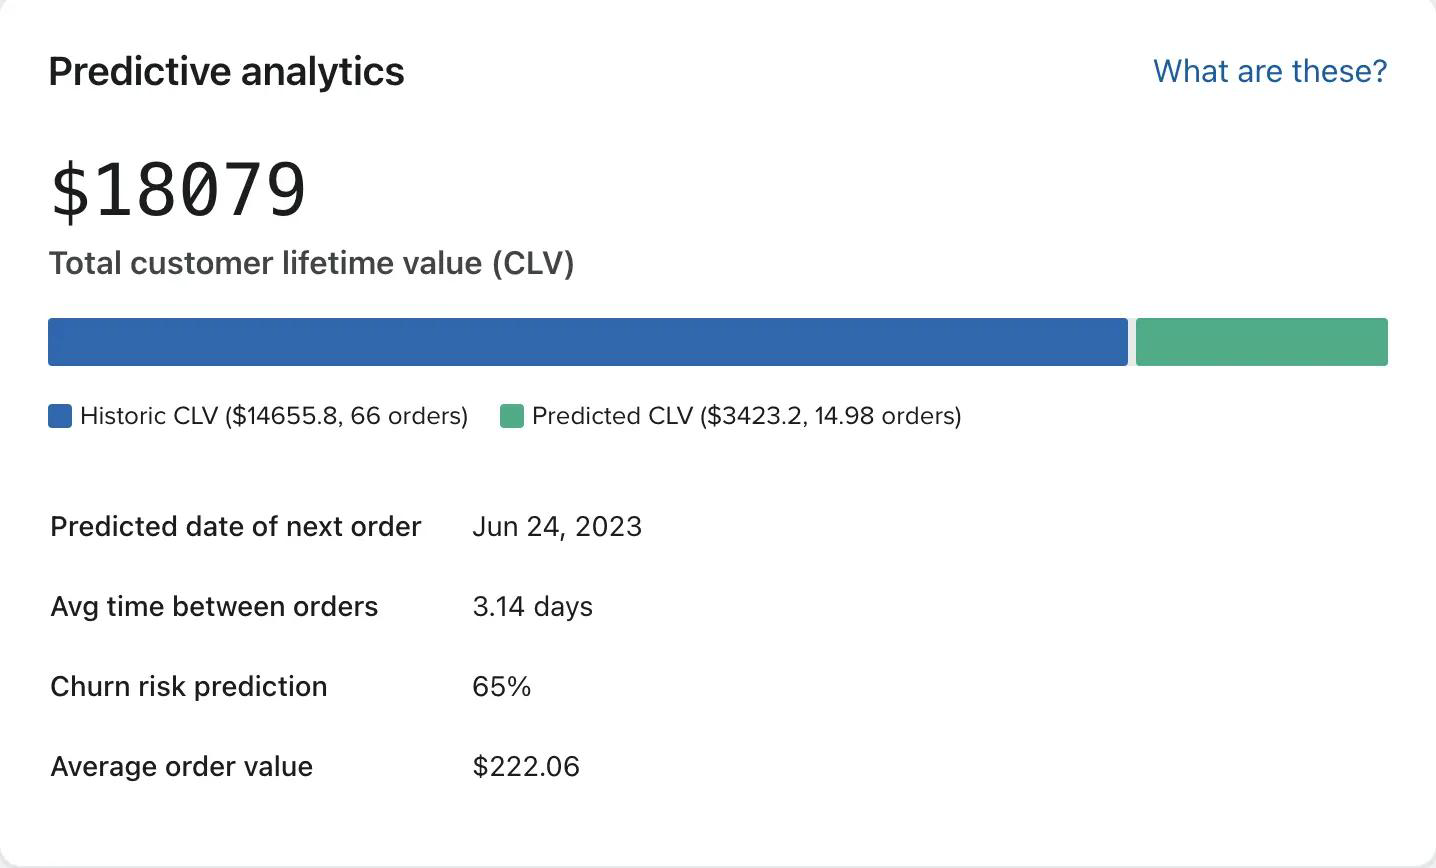
The second problem is the data. You don't have your customers' life events. You have their orders, their email behavior, their support tickets, their subscription history. That's plenty to predict churn, and it's what the real tools run on. Klaviyo scores every customer on churn risk off the order data alone, retrained weekly, and calls anyone over a 66% chance of no purchase in 90 days "high risk." No horoscope required. The score is the easy part; what you do the moment it fires is the rest. A vendor reaching for "social media activity and life events" is describing a demo, not a system that runs on a Monday morning.
What an honest number looks like
Here's the quiet part. The real numbers are less exciting than the fake ones, and that's exactly why you can trust them.
Acting on a churn score measurably lowers churn, usually by a point or two, not by multiples. Personalization done well adds 5% to 15% to revenue, per McKinsey. Neither sounds like much next to 487%. Run one through a supplements P&L and it's plenty.
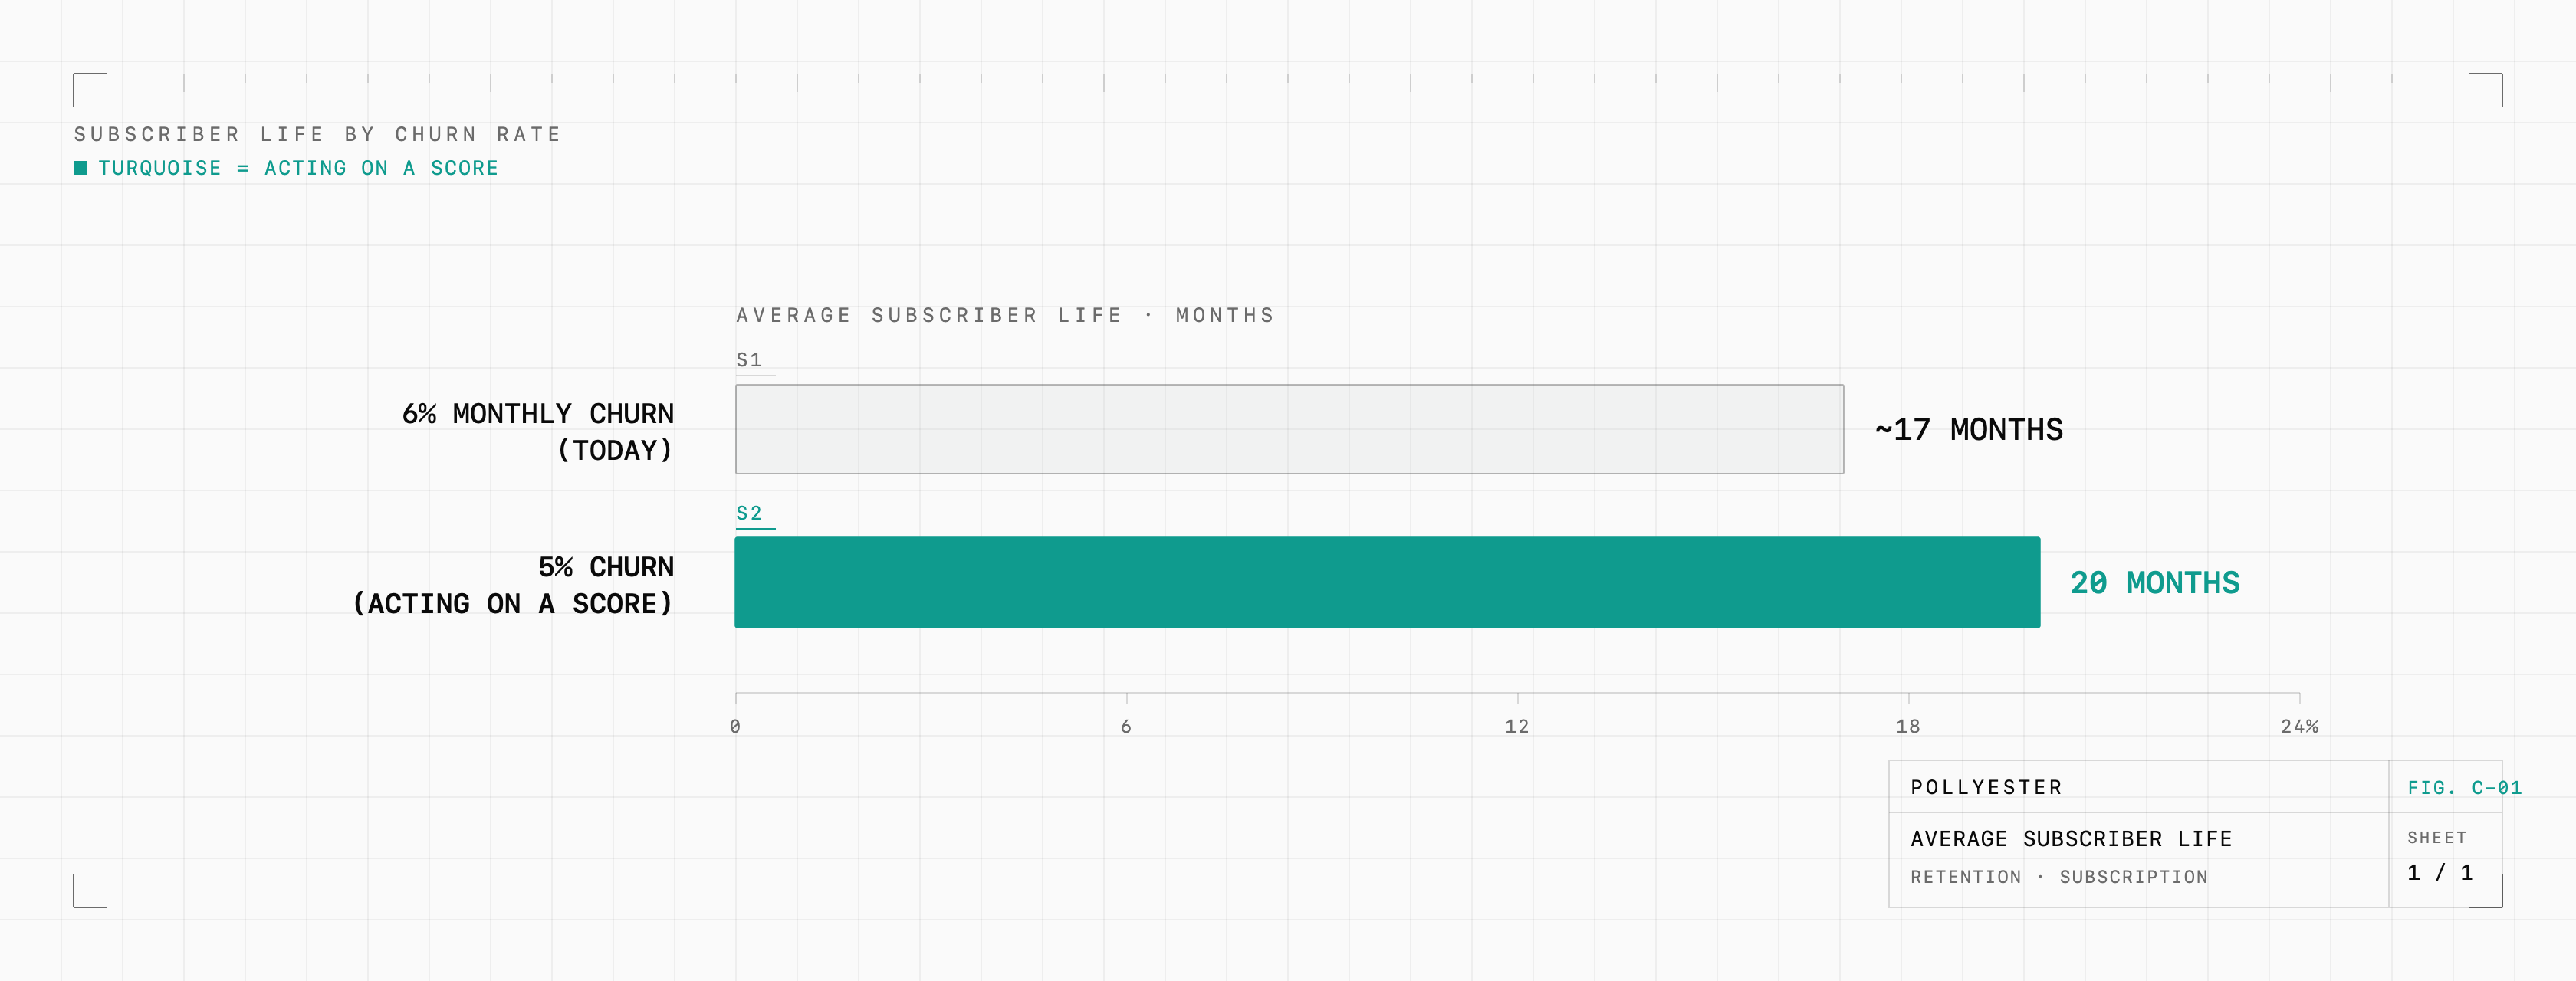
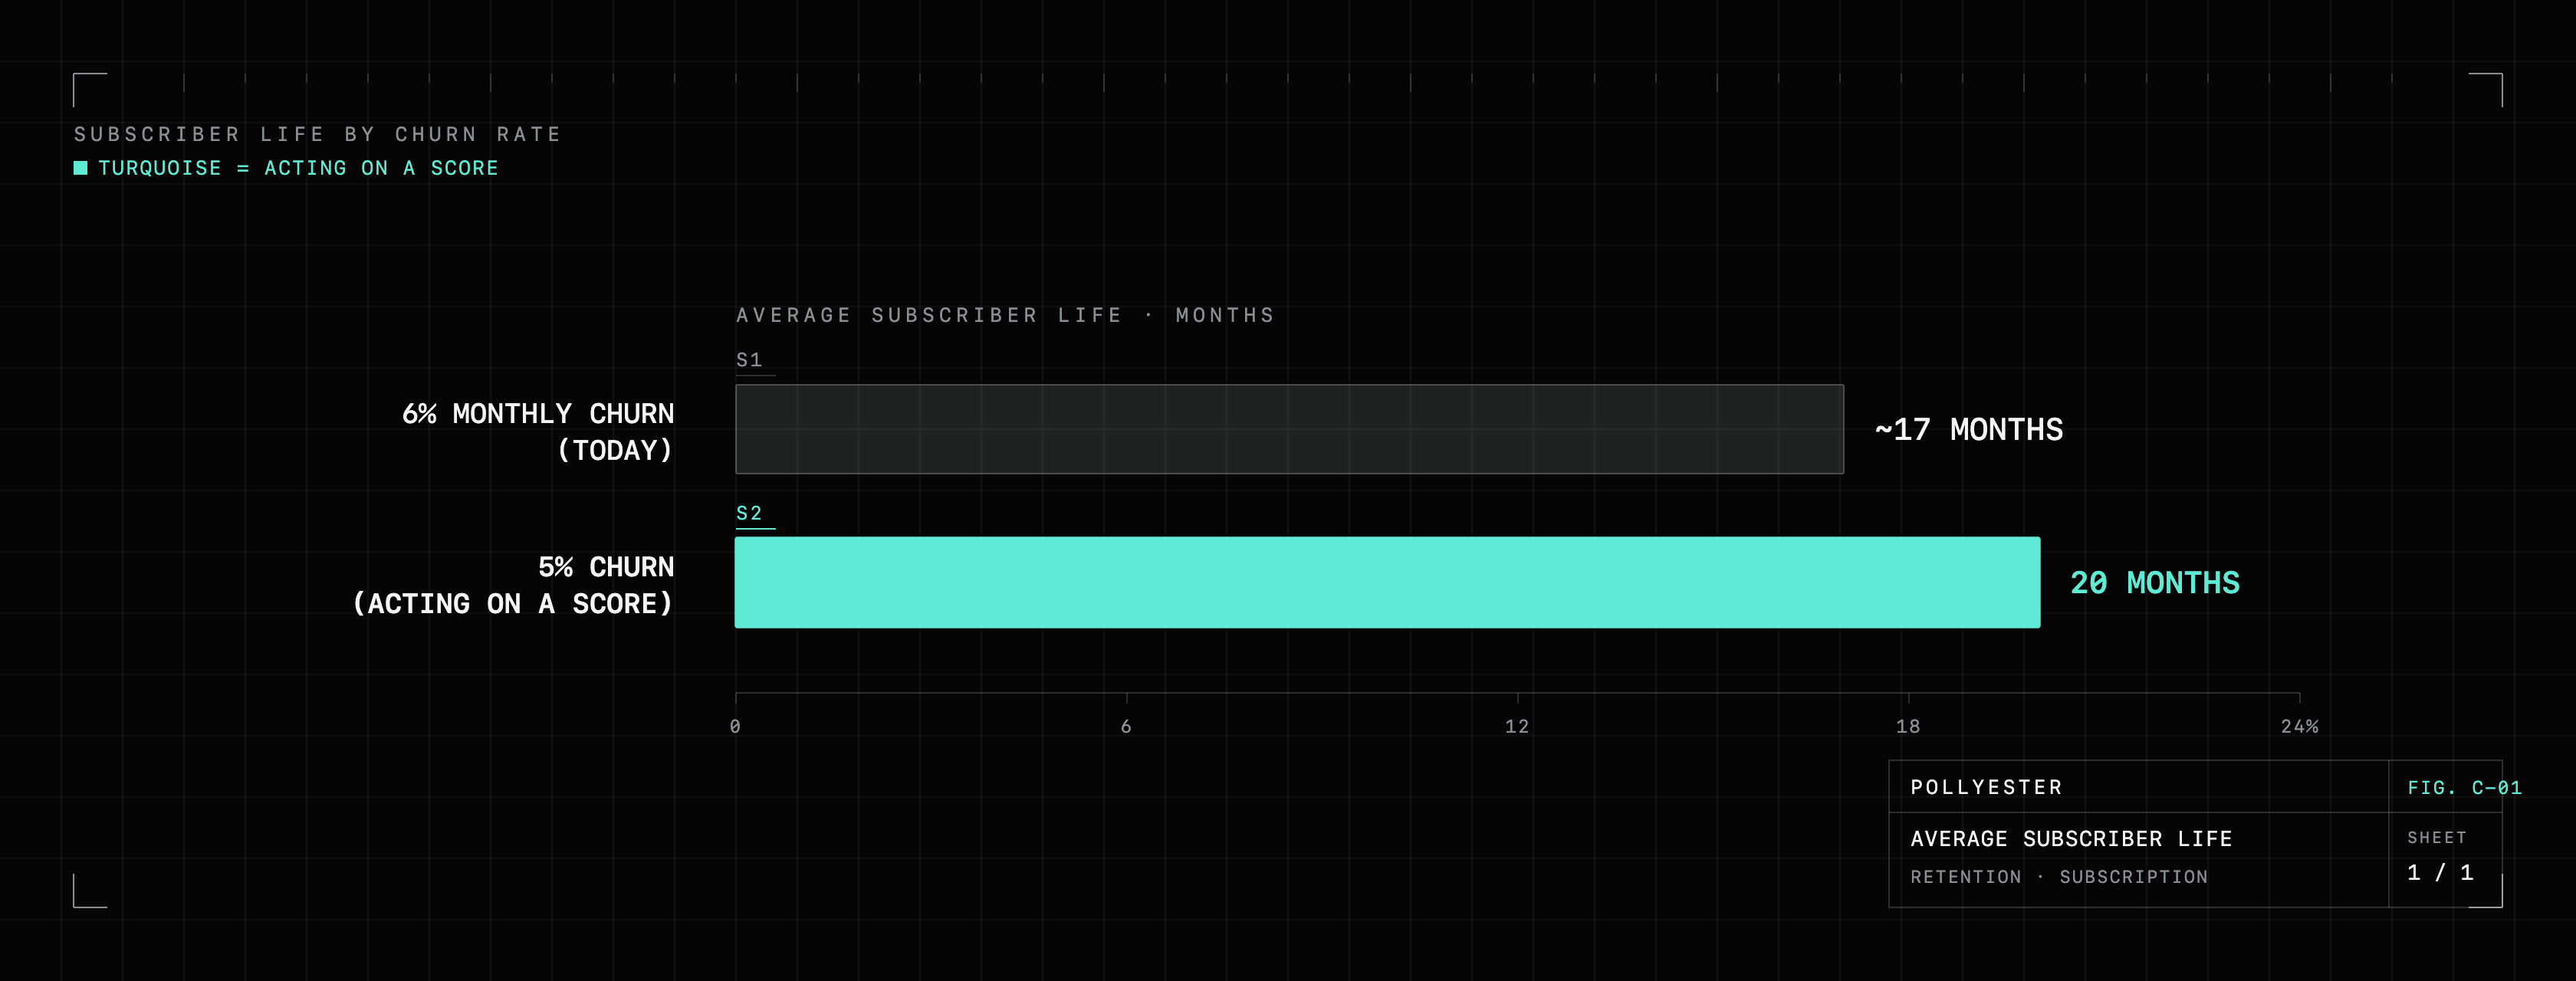
Say you're at 6% monthly churn on your subscription base, which is decent for replenishment. Take a point off, 6% to 5%, the kind of move acting on a churn score earns you. Average subscriber life is one divided by monthly churn, so 6% is a little under 17 months and 5% is 20 months. That's three extra months of orders from every subscriber you already have, roughly 20% more lifetime revenue per person, with no new acquisition spend behind it. On a base of any real size that's a large number, and it's the same mechanism Bain measured years ago: a 5% lift in retention moves profit 25% to 95%. Boring inputs, serious output.
The other half of an honest number is how it got measured. A real retention result comes with a control group, a slice of at-risk customers the model flagged but you left alone on purpose, so the saves you claim are the saves you actually caused and not customers who'd have reordered on their own. Without that group you're back to the survivorship trick, crediting the model for people who never needed the nudge. It's the least glamorous line in the whole test and the only one that proves the rest.
The loudest numbers tend to be decoration, and the real wins are usually too dull to make a headline.
The proof is boring, and that's the point
Zoom out and the pattern holds well past retention. MIT's 2025 study of AI in business found 95% of company GenAI pilots delivered no measurable impact on the P&L. The detail underneath is the useful one: more than half the money went into sales and marketing, the flashy front-of-house work, while the actual returns showed up in back-office jobs nobody writes a case study about. The 5% who got a return mostly bought tools from outside vendors and pointed them at an unglamorous, nameable process.
Read that next to the 487% posts and the pattern is consistent. The loudest numbers tend to be decoration, and the real wins are usually too dull to make a headline.
The kicker
If you're evaluating a predictive-retention vendor, the boring pitch is the strong one. Ask what churn rate it moves and off what base. Ask which brand you can call, and how they proved the saves came from the model and not from customers who'd have reordered anyway. A vendor with a real system answers in specifics and brings up the control group before you do. If the answers stay round and the brand names stay unsearchable, you already have your answer.
The credible retention numbers were never going to impress anyone at a glance. In a field selling you 487%, the unimpressive number is the one to trust.